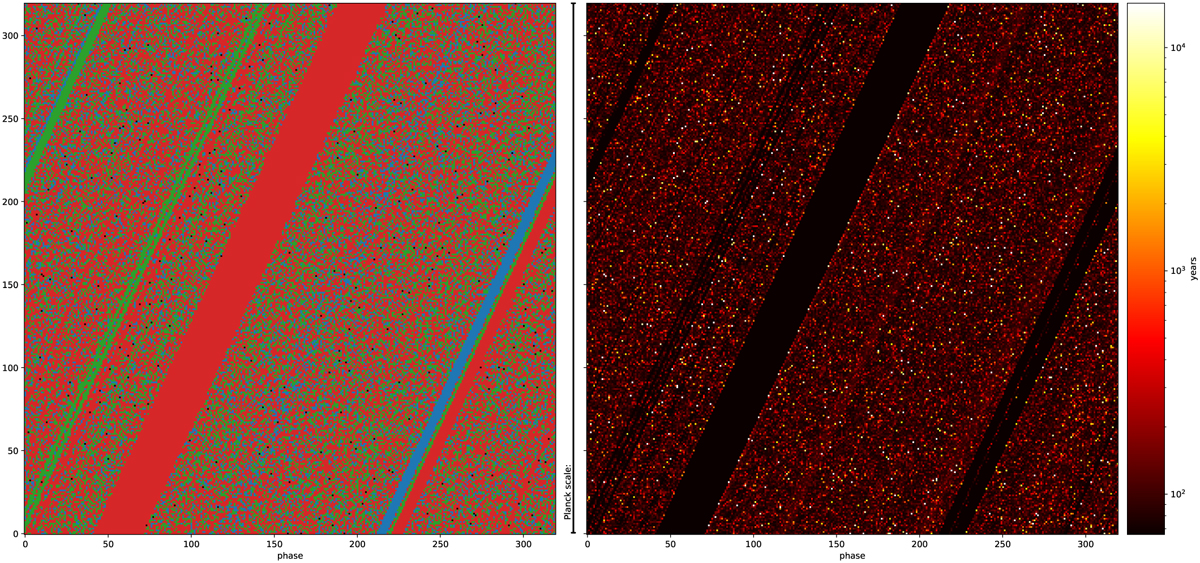
Fig. 10
Download original image
Space of the initial configurations, colour-coded by the ejected particle (left) and lifetime of the system (right). Each pixel corresponds to a realization on a 320 × 320 grid. As in Fig. 5, the axes denote binary phase and inclination, but since displaying the actual values in degrees would require too many digits, we just show the realization number on the grid. The size of the box is equivalent to a perturbation in the particles’s positions comparable to the Planck length. The simulations were run with BRUTUS with a tolerance of 10−63 and a word length of 356 bits.
Current usage metrics show cumulative count of Article Views (full-text article views including HTML views, PDF and ePub downloads, according to the available data) and Abstracts Views on Vision4Press platform.
Data correspond to usage on the plateform after 2015. The current usage metrics is available 48-96 hours after online publication and is updated daily on week days.
Initial download of the metrics may take a while.