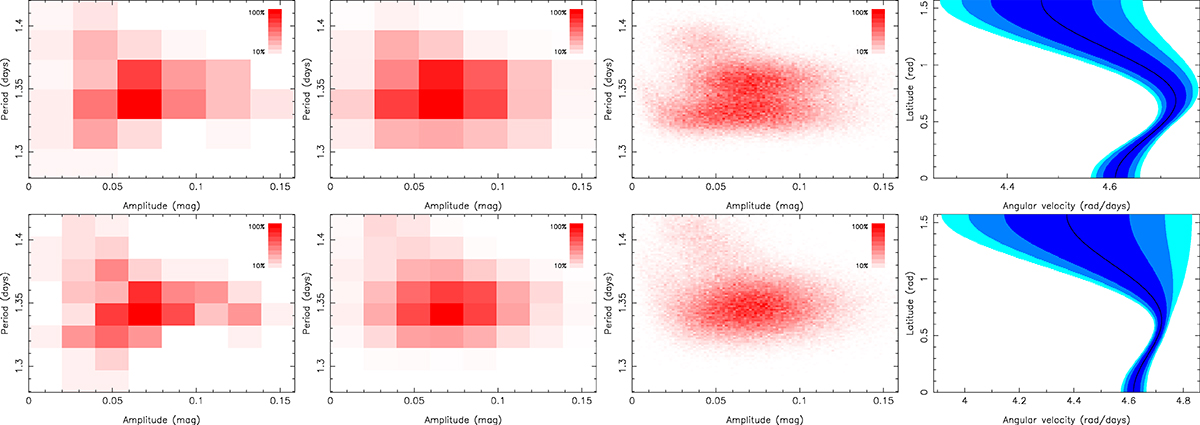
Fig. 3.
Download original image
Data of V889 Her and maximum a posteriori model for Ts = 15 days and for grids with n = 6 (top row) and n = 8 (bottom row). The model has k = 2 and uniform latitude distribution for spots. The first plot on the left hand side represents data, second one represents the corresponding statistical model, third plot shows a high-precision model in a 100 × 100 grid, and the last plot visualises the corresponding differential rotation curve with 1, 2, and 3-σ uncertainties (dark to light blue). The high-resolution version of the model is added to enable visual inspection of the underlying distribution. The shades of red represent the distribution with respect to its maximum.
Current usage metrics show cumulative count of Article Views (full-text article views including HTML views, PDF and ePub downloads, according to the available data) and Abstracts Views on Vision4Press platform.
Data correspond to usage on the plateform after 2015. The current usage metrics is available 48-96 hours after online publication and is updated daily on week days.
Initial download of the metrics may take a while.