Open Access
Fig. 2.
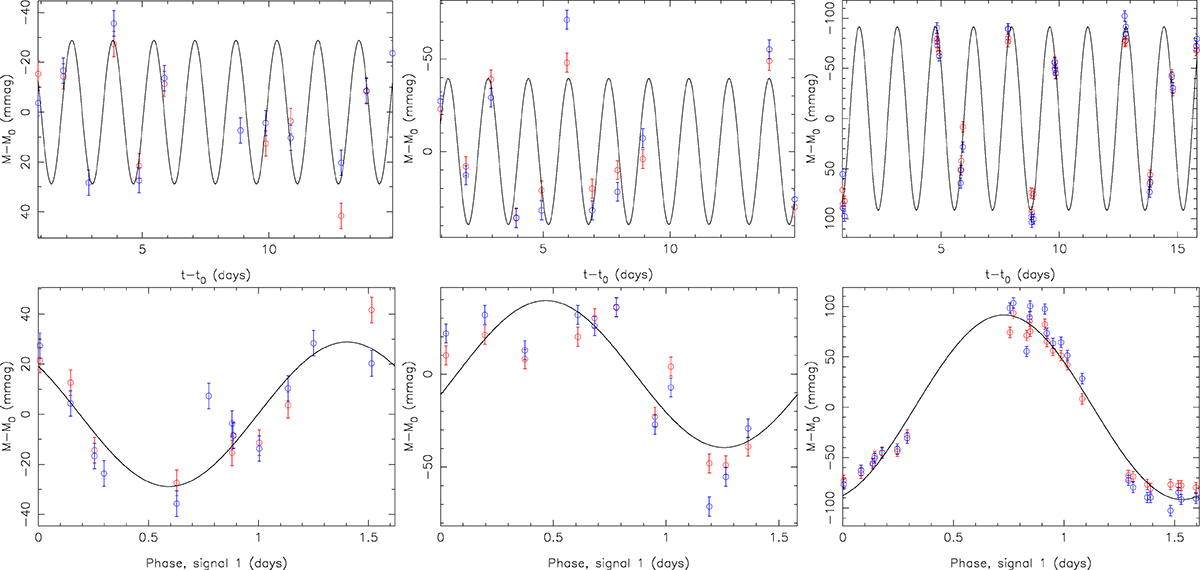
Download original image
Example plots of three data subsets for LQ Hya and 15-day baselines as a function of time (top panels) and signal phase (bottom panels). The red and blue circles represent V- and B-band magnitudes. The solid black curve denotes the fitted sinusoidal function.
Current usage metrics show cumulative count of Article Views (full-text article views including HTML views, PDF and ePub downloads, according to the available data) and Abstracts Views on Vision4Press platform.
Data correspond to usage on the plateform after 2015. The current usage metrics is available 48-96 hours after online publication and is updated daily on week days.
Initial download of the metrics may take a while.