Fig. 1
Download original image
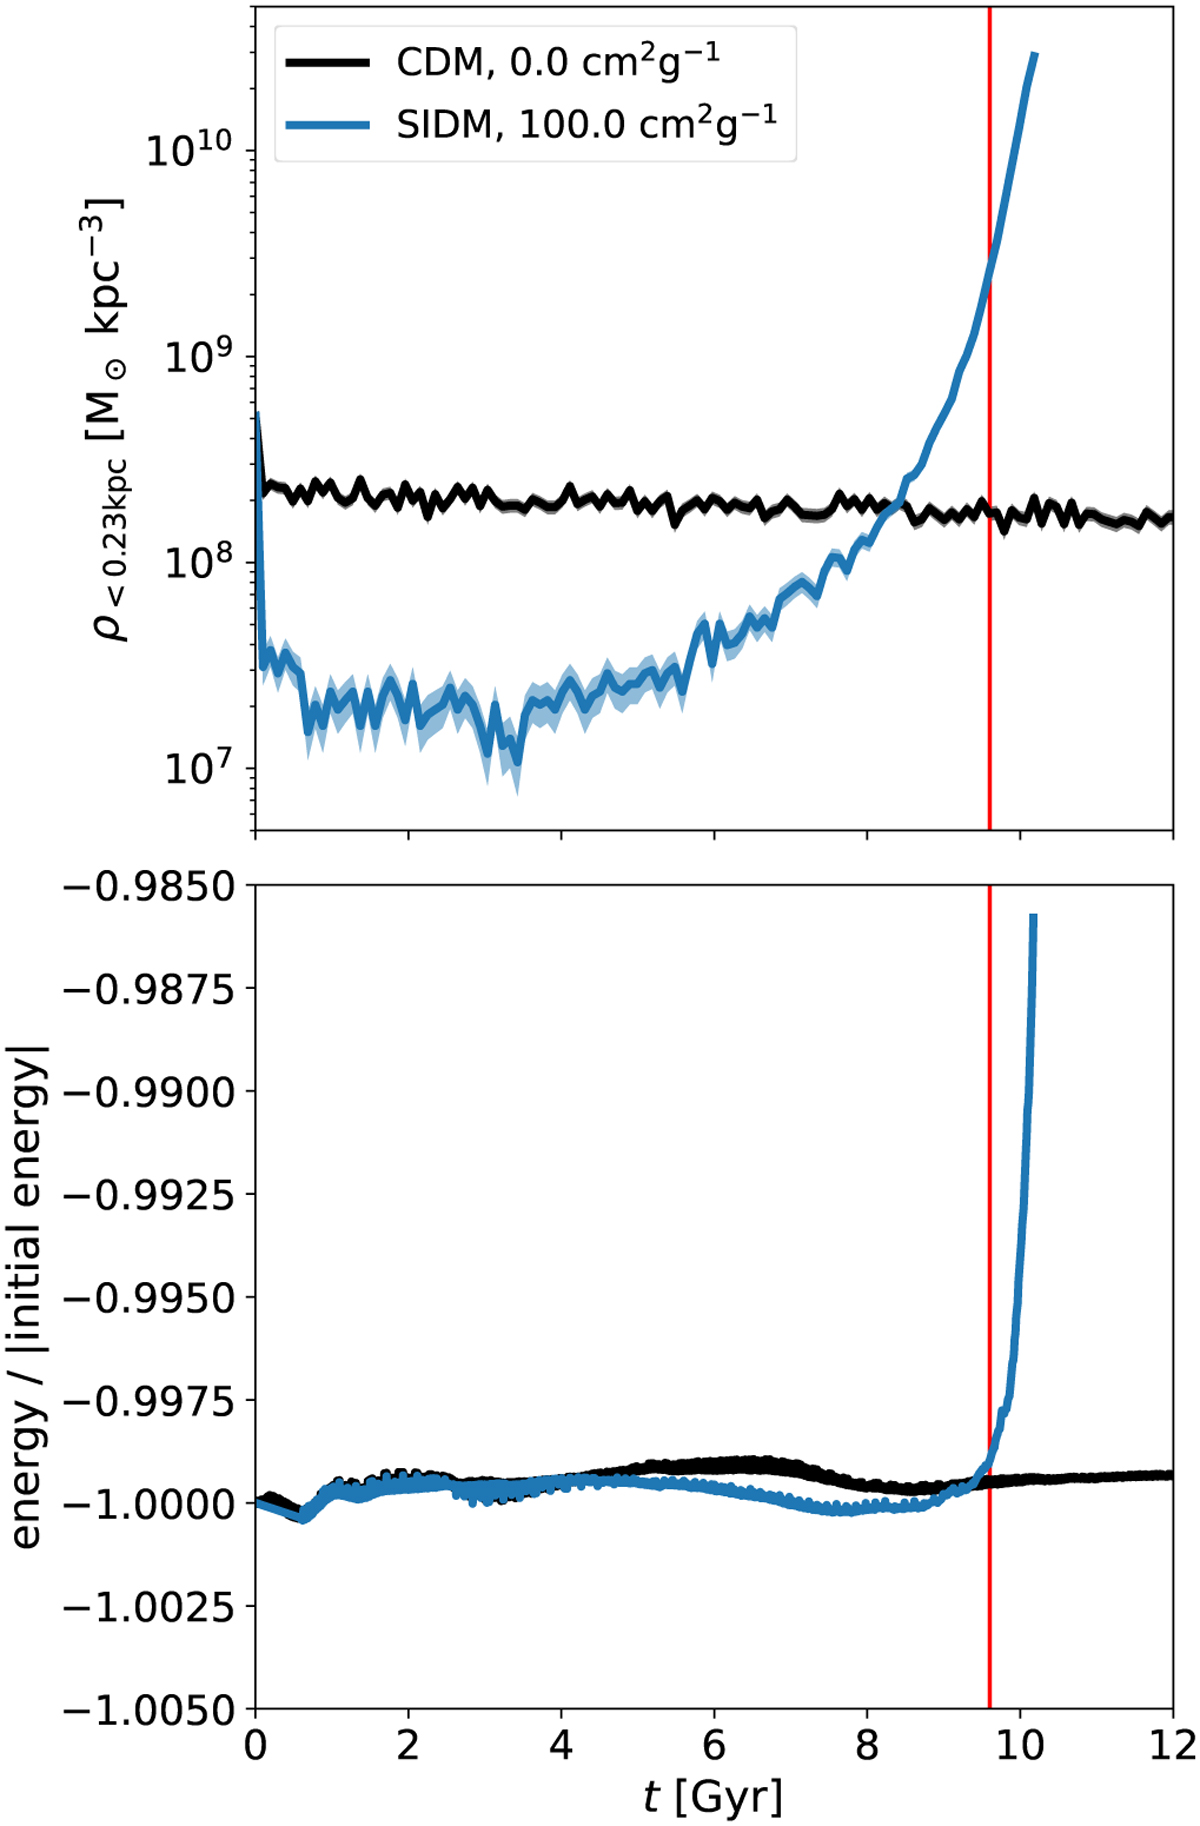
Central density of the simulated halo (upper panel) and the total energy relative to its initial value (lower panel) are shown as a function of time. We display the results for our simulation with collisionless DM (black) and SIDM (blue). In the upper panels, the error on the central densities is indicated by the bands. The vertical red line indicates t = 9.6 Gyr, to roughly mark the point in time when the total energy starts to increase. The simulations were run with a variable time step and our wider opening criterion (ErrTolForceAcc = 5 × 10⁻⁴).
Current usage metrics show cumulative count of Article Views (full-text article views including HTML views, PDF and ePub downloads, according to the available data) and Abstracts Views on Vision4Press platform.
Data correspond to usage on the plateform after 2015. The current usage metrics is available 48-96 hours after online publication and is updated daily on week days.
Initial download of the metrics may take a while.