Fig. 7.
Download original image
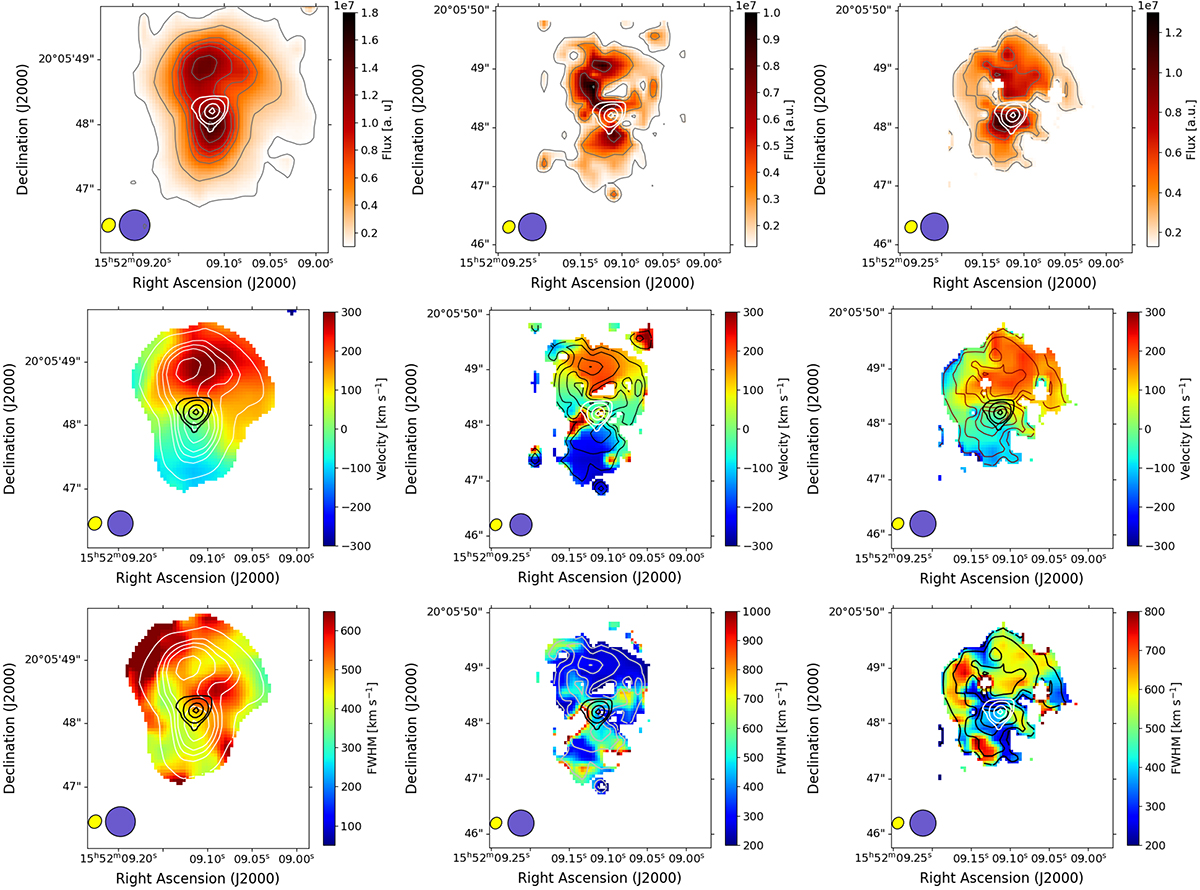
H2 0–0 S(3) emission-line morphology (top), velocities (centre), and FWHM line widths (bottom) with the JVLA 8.4 GHz radio continuum shown as thick contours near the centre. Thin contours show the emission-line morphology in the top left panel to ease orientation. Left to right: single-component fit, systemic line component, and blue-shifted line component. The emission-line morphology and single-component and systemic velocity maps show an hour-glass gas morphology with a strongly blue and red-shifted bipolar velocity field, consistent with a pair of bubbles that are being inflated by the radio source at the centre.
Current usage metrics show cumulative count of Article Views (full-text article views including HTML views, PDF and ePub downloads, according to the available data) and Abstracts Views on Vision4Press platform.
Data correspond to usage on the plateform after 2015. The current usage metrics is available 48-96 hours after online publication and is updated daily on week days.
Initial download of the metrics may take a while.