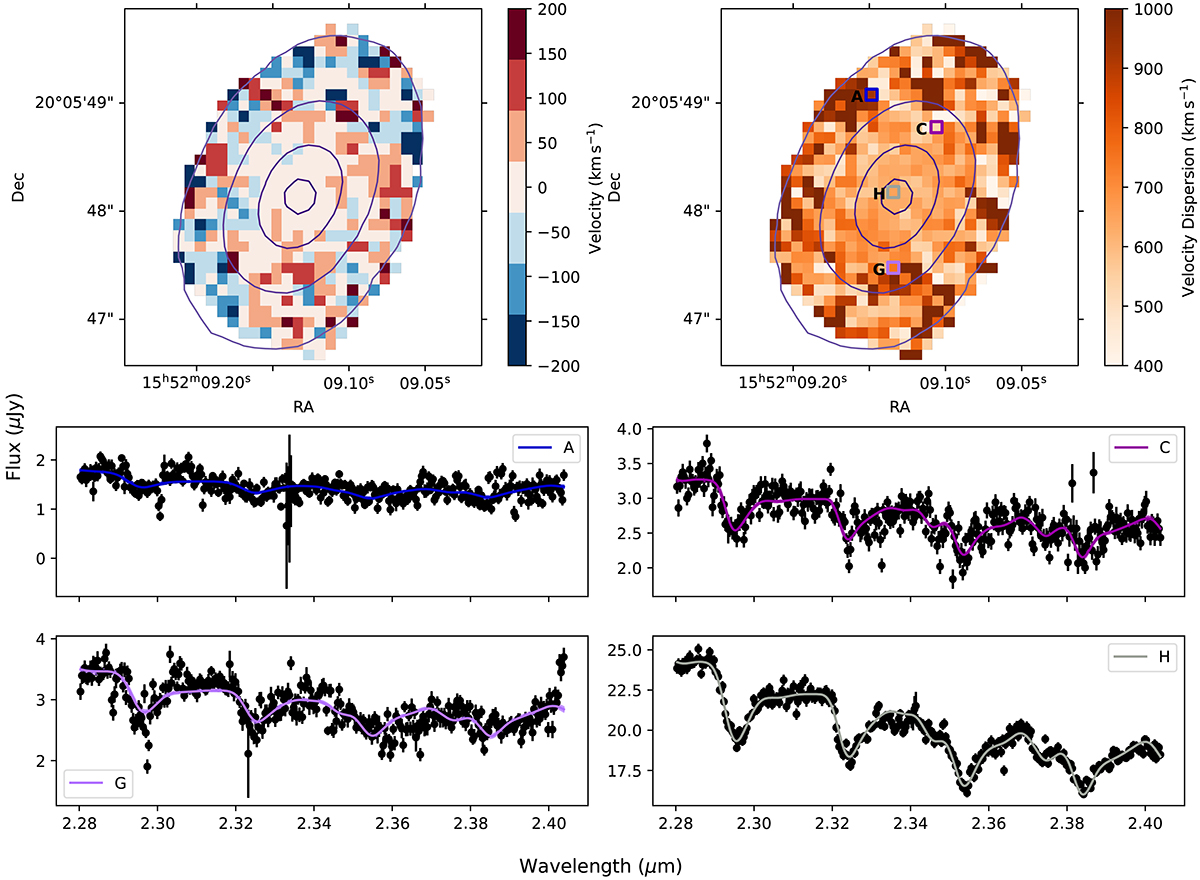
Fig. 2.
Download original image
Results of CO band head template modelling. Top-left: CO band head velocity map from our template fit. For clarity, while we model all spaxels, here we only plot the velocities for spaxels with an average signal-to-noise ratio of S/N > 10. Top right: FWHM of the velocity dispersion for the CO features, the spaxels with an average S/N < 10 are omitted. Overplotted as coloured squares: Positions of the four spaxels displayed in the bottom four panels. The spaxel positions and labels match those of Fig. 1. Overplotted on both top plots in purple: Contours of the near-IR continuum emission in Fig. 6. Bottom: model fit to the CO features in four selected spaxels. The filled regions are the 1σ uncertainties.
Current usage metrics show cumulative count of Article Views (full-text article views including HTML views, PDF and ePub downloads, according to the available data) and Abstracts Views on Vision4Press platform.
Data correspond to usage on the plateform after 2015. The current usage metrics is available 48-96 hours after online publication and is updated daily on week days.
Initial download of the metrics may take a while.