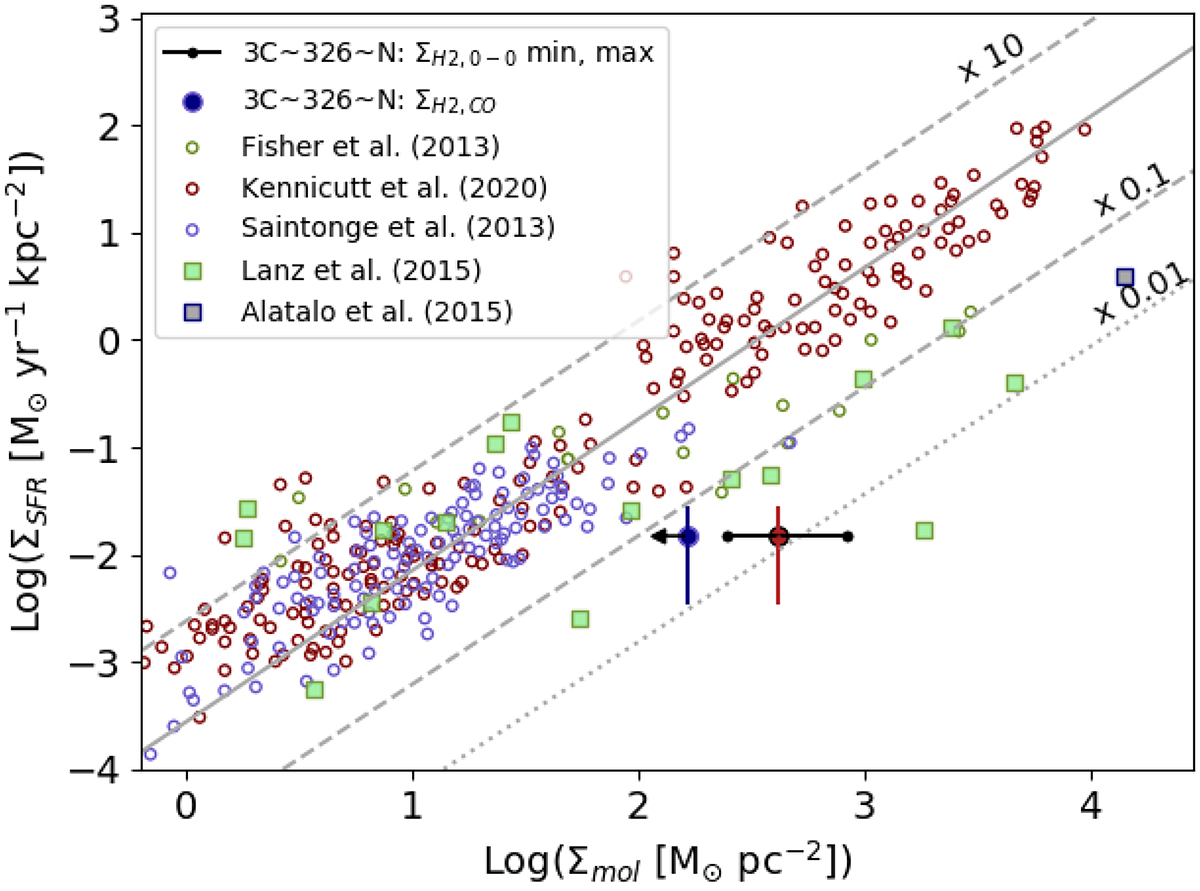
Fig. 13.
Download original image
Kennicutt–Schmidt law between star formation rate and molecular gas mass surface density. The large blue and red dot show the position of 3C 326 N when using the mass surface density of cold molecular gas probed by CO(1–0) and H2 0–0 lines, respectively. For the latter estimate, the black line shows the range of surface-brightness observed with MIRI. Small empty circles show several sets of normally star-forming galaxies in the nearby Universe taken from Fischer et al. (2013), Kennicutt (2020), and Saintonge et al. (2013). Green and grey squares show the MOHEGs of Ogle et al. (2010) and Alatalo et al. (2015).
Current usage metrics show cumulative count of Article Views (full-text article views including HTML views, PDF and ePub downloads, according to the available data) and Abstracts Views on Vision4Press platform.
Data correspond to usage on the plateform after 2015. The current usage metrics is available 48-96 hours after online publication and is updated daily on week days.
Initial download of the metrics may take a while.