Fig. 11.
Download original image
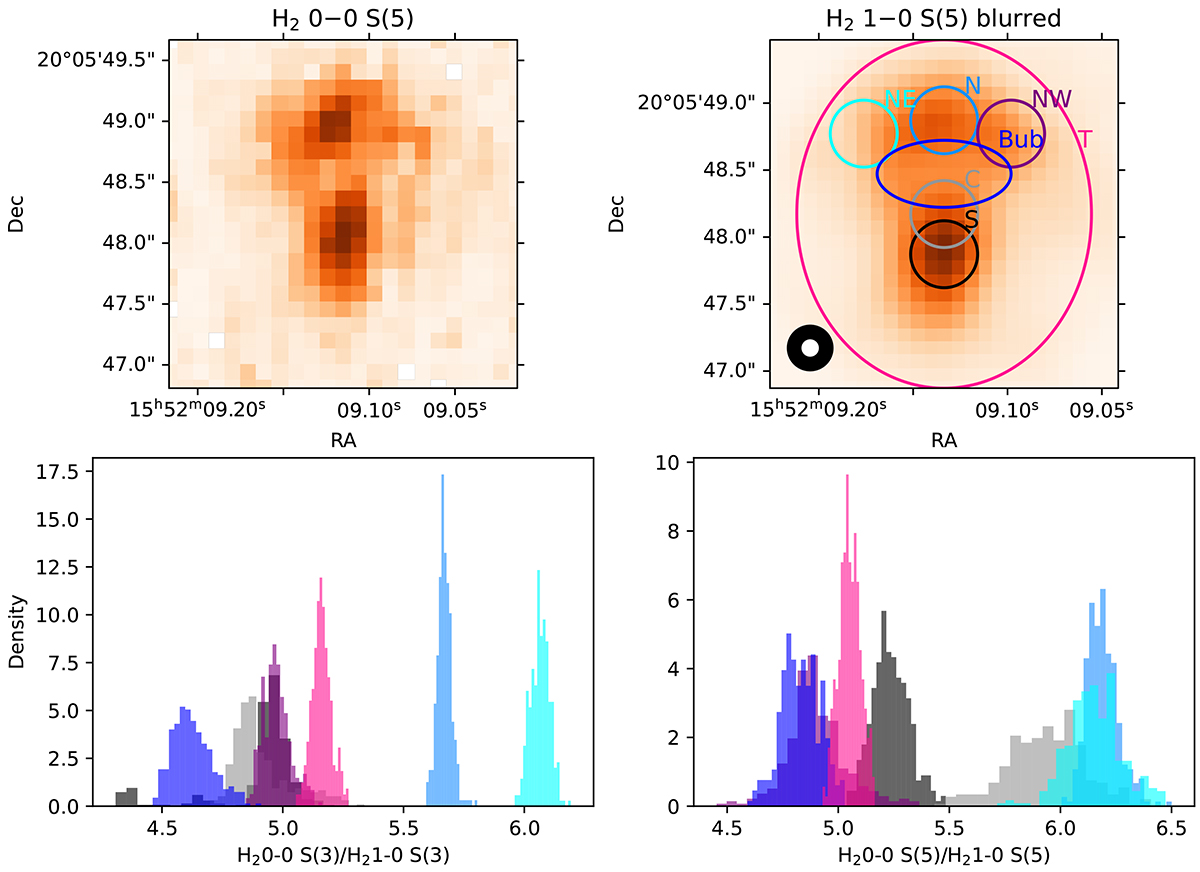
Comparison of rotational and ro-vibrational line emission for several apertures. Top: integrated flux for the H20–0 S(5) line and the H21–0 S(5) line as titled. The H21–0 S(5) flux image has been convolved to the PSF at the H20–0 S(5) line. The original PSF for H21–0 S(5) and the post-convolution PSF are the white and black filled circles in the H21–0 S(5) plot, respectively. Bottom: ratio of 1–0 to 0–0 line fluxes for the apertures shown in the top image.
Current usage metrics show cumulative count of Article Views (full-text article views including HTML views, PDF and ePub downloads, according to the available data) and Abstracts Views on Vision4Press platform.
Data correspond to usage on the plateform after 2015. The current usage metrics is available 48-96 hours after online publication and is updated daily on week days.
Initial download of the metrics may take a while.