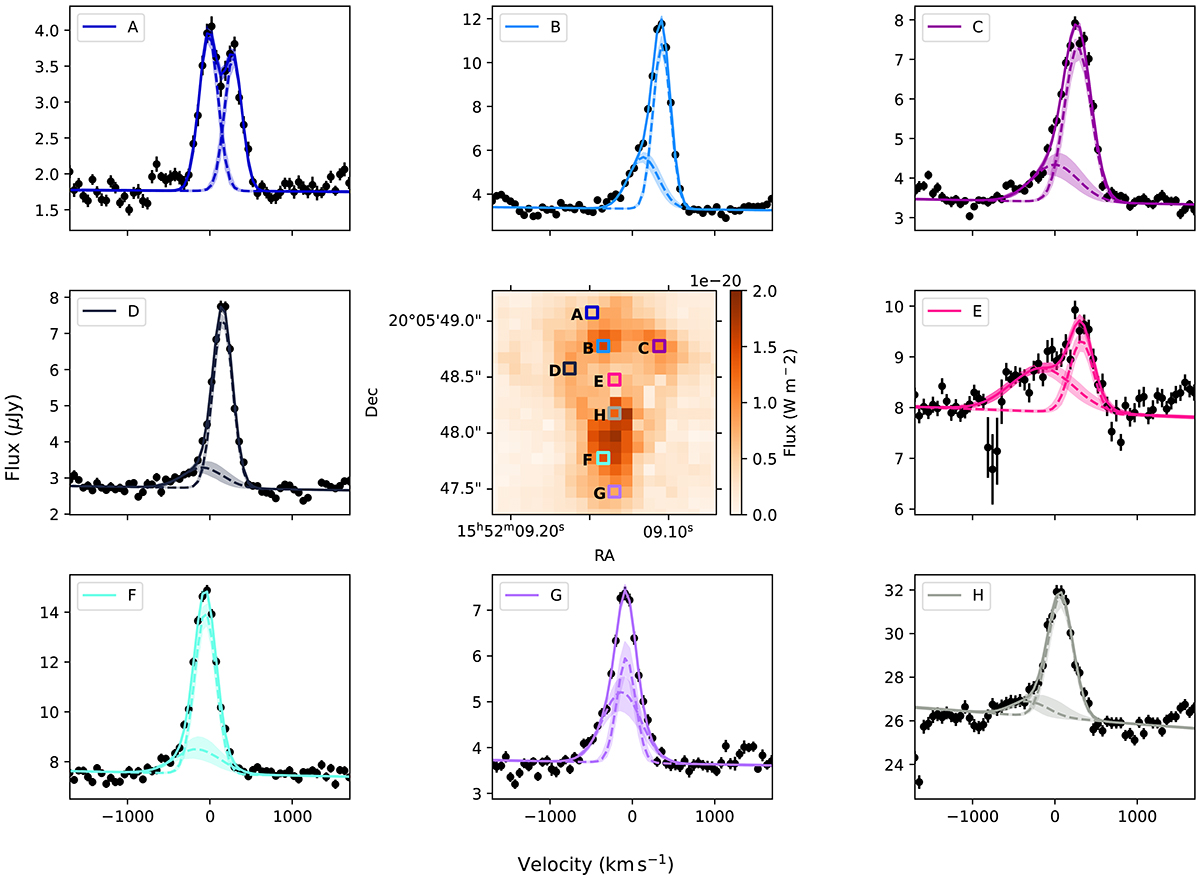
Fig. 1.
Download original image
H21–0 S(3) Gaussian line model results compared to data for different spaxels and resulting integrated line emission map. Middle: integrated model flux for H21–0 S(3). Edges: Gaussian model fit to the H21–0 S(3) line for different spaxels of the central image compared to data. The coloured squares in the image represent the position of the plotted spaxel of the same colour. Dashed lines are individual Gaussian components and the solid line is the summed Gaussians. Shaded regions represent the 1σ errors. These spectra area also a good illustration of the high quality of the date and the automatic fitting routine.
Current usage metrics show cumulative count of Article Views (full-text article views including HTML views, PDF and ePub downloads, according to the available data) and Abstracts Views on Vision4Press platform.
Data correspond to usage on the plateform after 2015. The current usage metrics is available 48-96 hours after online publication and is updated daily on week days.
Initial download of the metrics may take a while.