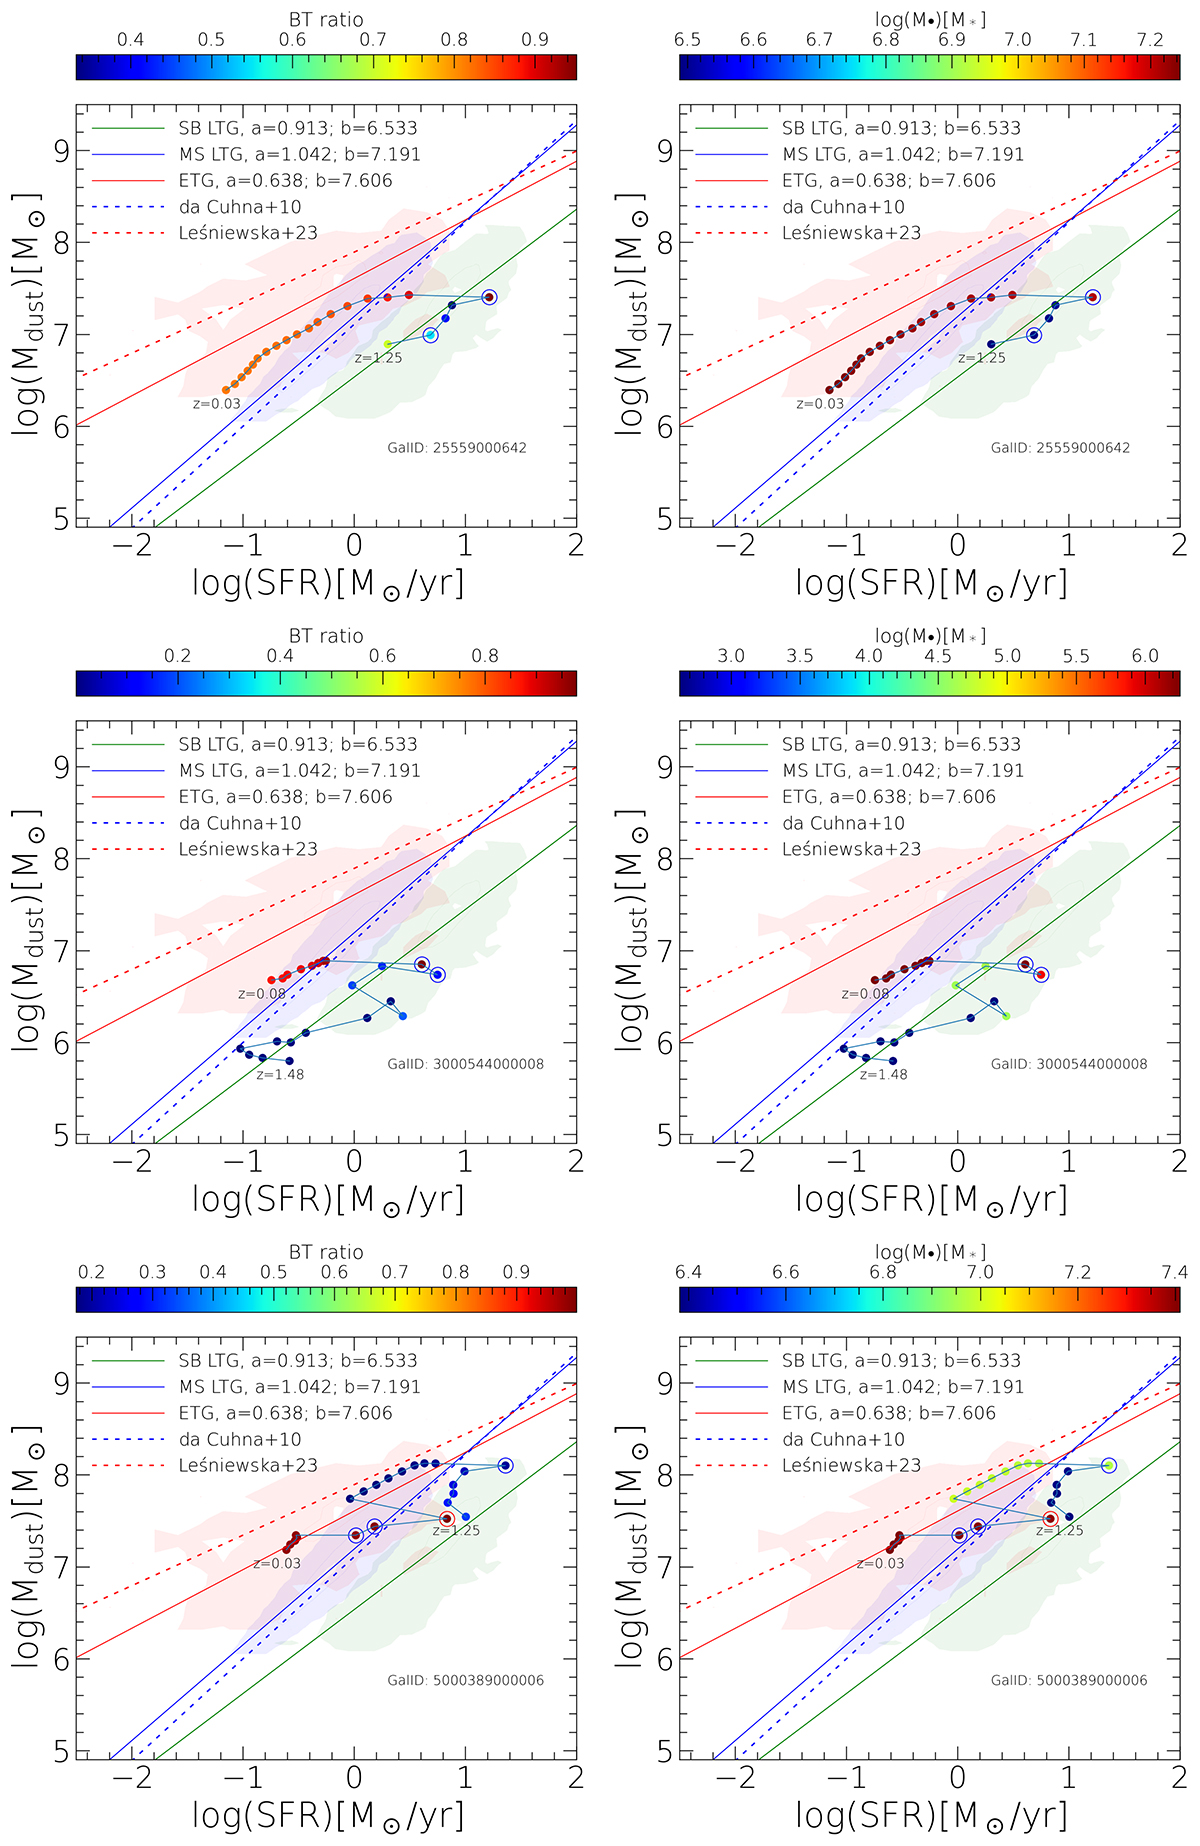
Fig. 7.
Download original image
Dust mass as a function of the SFR. Progenitors of the selected ETGs are connected with the lines. Empty red (blue) circles show the progenitor galaxy with a major (minor) merger event before that snapshot. Each row corresponds to one selected ETGs. The left column shows the colour-coded bulge-to-total mass ratio, whereas the right shows the same galaxy but colour-coded by the black hole mass.
Current usage metrics show cumulative count of Article Views (full-text article views including HTML views, PDF and ePub downloads, according to the available data) and Abstracts Views on Vision4Press platform.
Data correspond to usage on the plateform after 2015. The current usage metrics is available 48-96 hours after online publication and is updated daily on week days.
Initial download of the metrics may take a while.