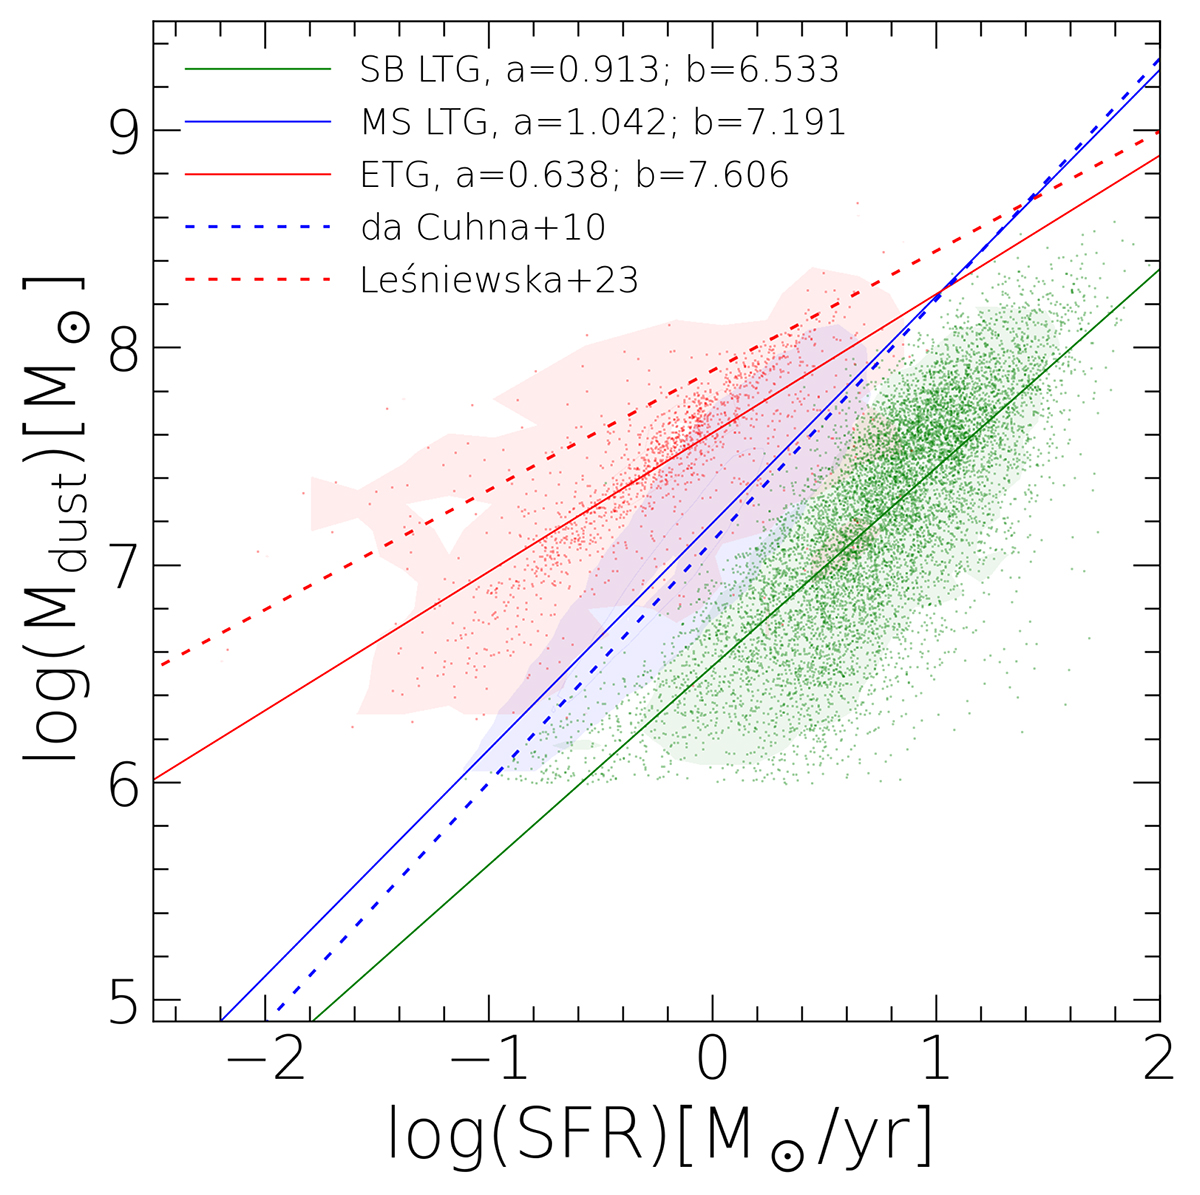
Fig. 6.
Download original image
Dust mass as a function of the SFR. The colours of the contours, lines, and points correspond to: ETGs (red), MS LTGs (blue), and SBGs (green). Power-law fits are described as log(Mdust) = a × log(SFR)+b with coefficients given in the legend. Red and blue dotted lines show fits from Leśniewska et al. (2023) and da Cunha et al. (2010), respectively. Individual MS LTG are not shown for the sake of clarity.
Current usage metrics show cumulative count of Article Views (full-text article views including HTML views, PDF and ePub downloads, according to the available data) and Abstracts Views on Vision4Press platform.
Data correspond to usage on the plateform after 2015. The current usage metrics is available 48-96 hours after online publication and is updated daily on week days.
Initial download of the metrics may take a while.