Fig. 4.
Download original image
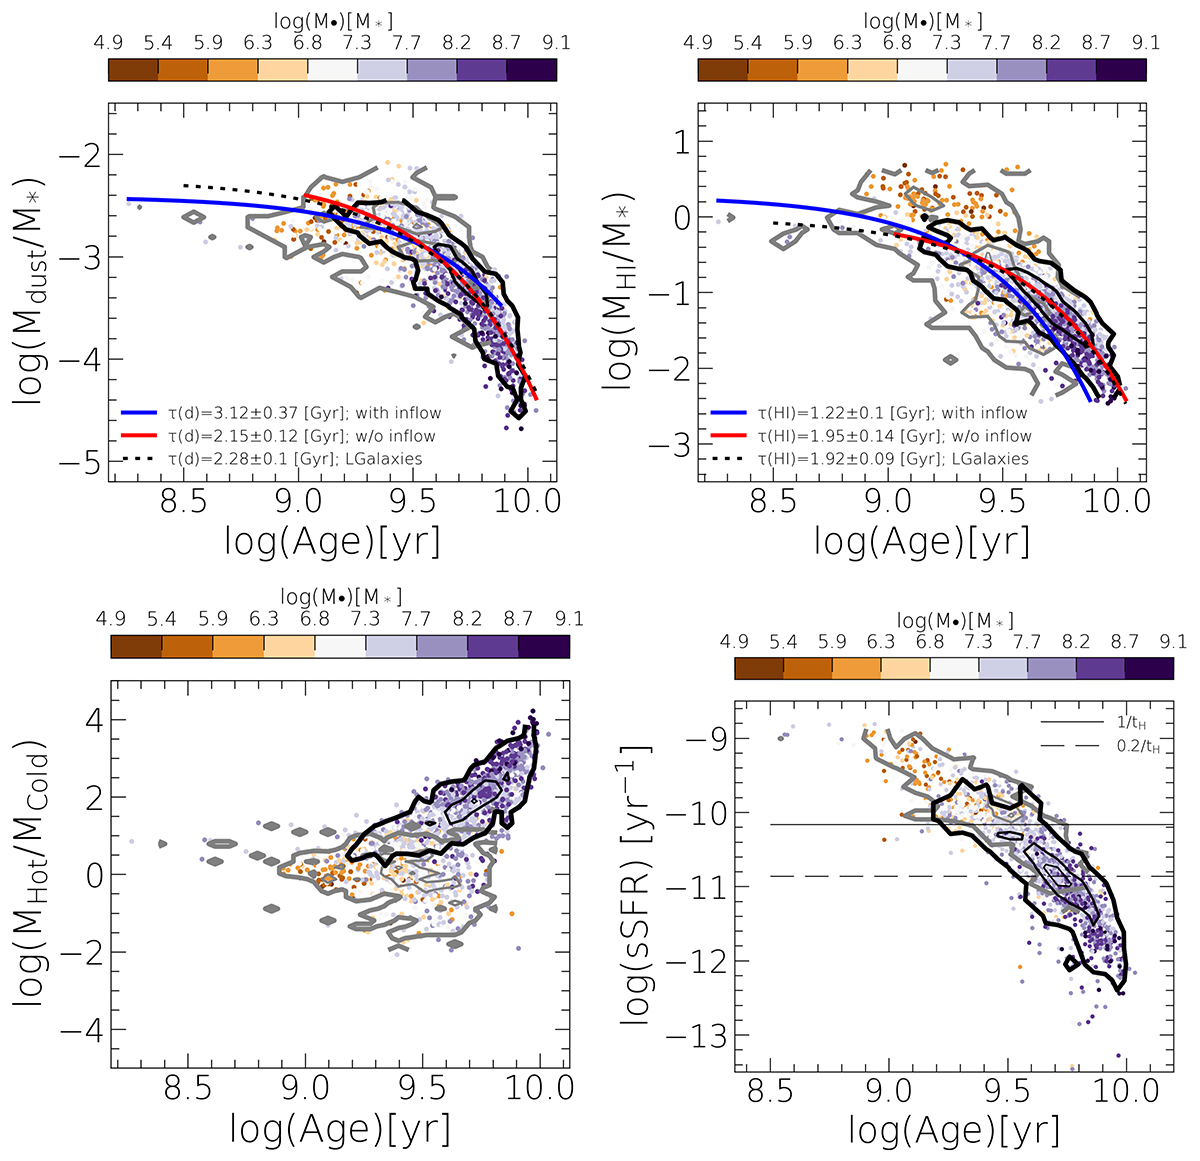
Dust-to-stellar mass ratio, and HI-to-stellar mass ratio as a function of light-weighted age (top). Blue and red solid curves show fit to sub-samples with and without the inflow, respectively. The black dotted line is the fit to the ETGs, the same as in Fig. 2. Hot-to-cold gas mass ratio as a function of age (bottom-left). Specific SFR as a function of age (bottom-right). Solid and dashed lines show ![]() and
and ![]() , where tH is the Hubble time at z = 0 (Rodríguez Montero et al. 2019). In all panels: points show our ETG sample colour-coded by the black hole mass, grey and black contours represent galaxies with and without an inflow of the material between the current (i.e. the snapshot at which the galaxy was selected) and the previous snapshot.
, where tH is the Hubble time at z = 0 (Rodríguez Montero et al. 2019). In all panels: points show our ETG sample colour-coded by the black hole mass, grey and black contours represent galaxies with and without an inflow of the material between the current (i.e. the snapshot at which the galaxy was selected) and the previous snapshot.
Current usage metrics show cumulative count of Article Views (full-text article views including HTML views, PDF and ePub downloads, according to the available data) and Abstracts Views on Vision4Press platform.
Data correspond to usage on the plateform after 2015. The current usage metrics is available 48-96 hours after online publication and is updated daily on week days.
Initial download of the metrics may take a while.