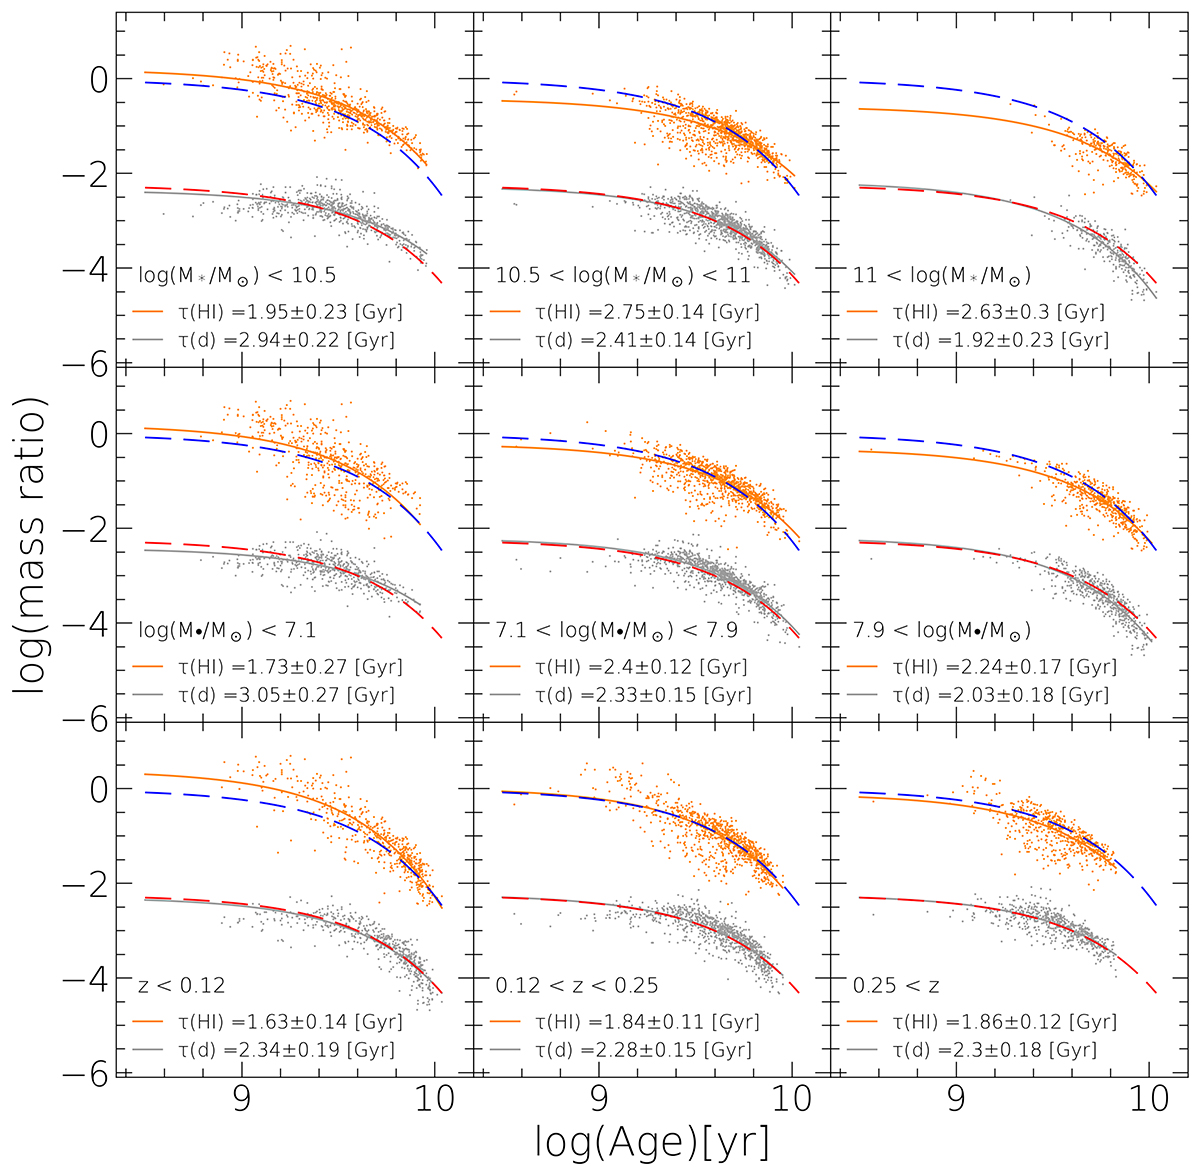
Fig. 3.
Download original image
HI-to-stellar and dust-to-stellar mass ratio as a function of light-weighted age. Orange and grey lines show fits to HI- and dust-to-stellar mass ratios for sub-samples divided into stellar mass (top row), the black hole-to-stellar mass ratio (middle), and redshift (bottom row) bins. Blue and red dashed lines show fits to the overall ETG sample from Fig. 2 and are given for reference.
Current usage metrics show cumulative count of Article Views (full-text article views including HTML views, PDF and ePub downloads, according to the available data) and Abstracts Views on Vision4Press platform.
Data correspond to usage on the plateform after 2015. The current usage metrics is available 48-96 hours after online publication and is updated daily on week days.
Initial download of the metrics may take a while.