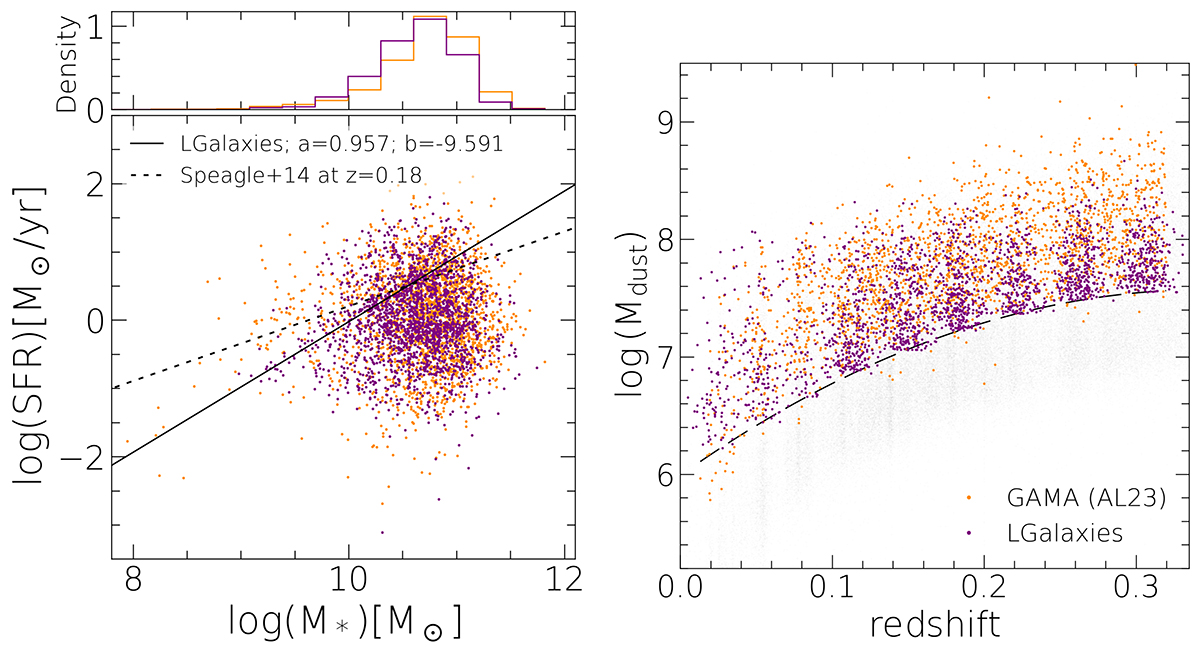
Fig. 1.
Download original image
SFR as a function of stellar mass (left). The solid line shows the MS from the L-GALAXIES2020 simulations estimated using LTGs (see main text for details) and is a power-law fit described as log(SFR) = a × log(M*)+b with coefficients given in the legend. The dotted line shows the MS estimated using a prescription from Speagle et al. (2014), both at z = 0.18. Orange and gray points show the GAMA, and L-GALAXIES2020 ETG samples. Normalised stellar mass distribution for the mentioned samples (top). Dust mass as a function of redshift (right). The dashed line shows the dust mass limit estimated for the GAMA sample. More details are given in Sect. 2.3.
Current usage metrics show cumulative count of Article Views (full-text article views including HTML views, PDF and ePub downloads, according to the available data) and Abstracts Views on Vision4Press platform.
Data correspond to usage on the plateform after 2015. The current usage metrics is available 48-96 hours after online publication and is updated daily on week days.
Initial download of the metrics may take a while.