Open Access
Fig. 8.
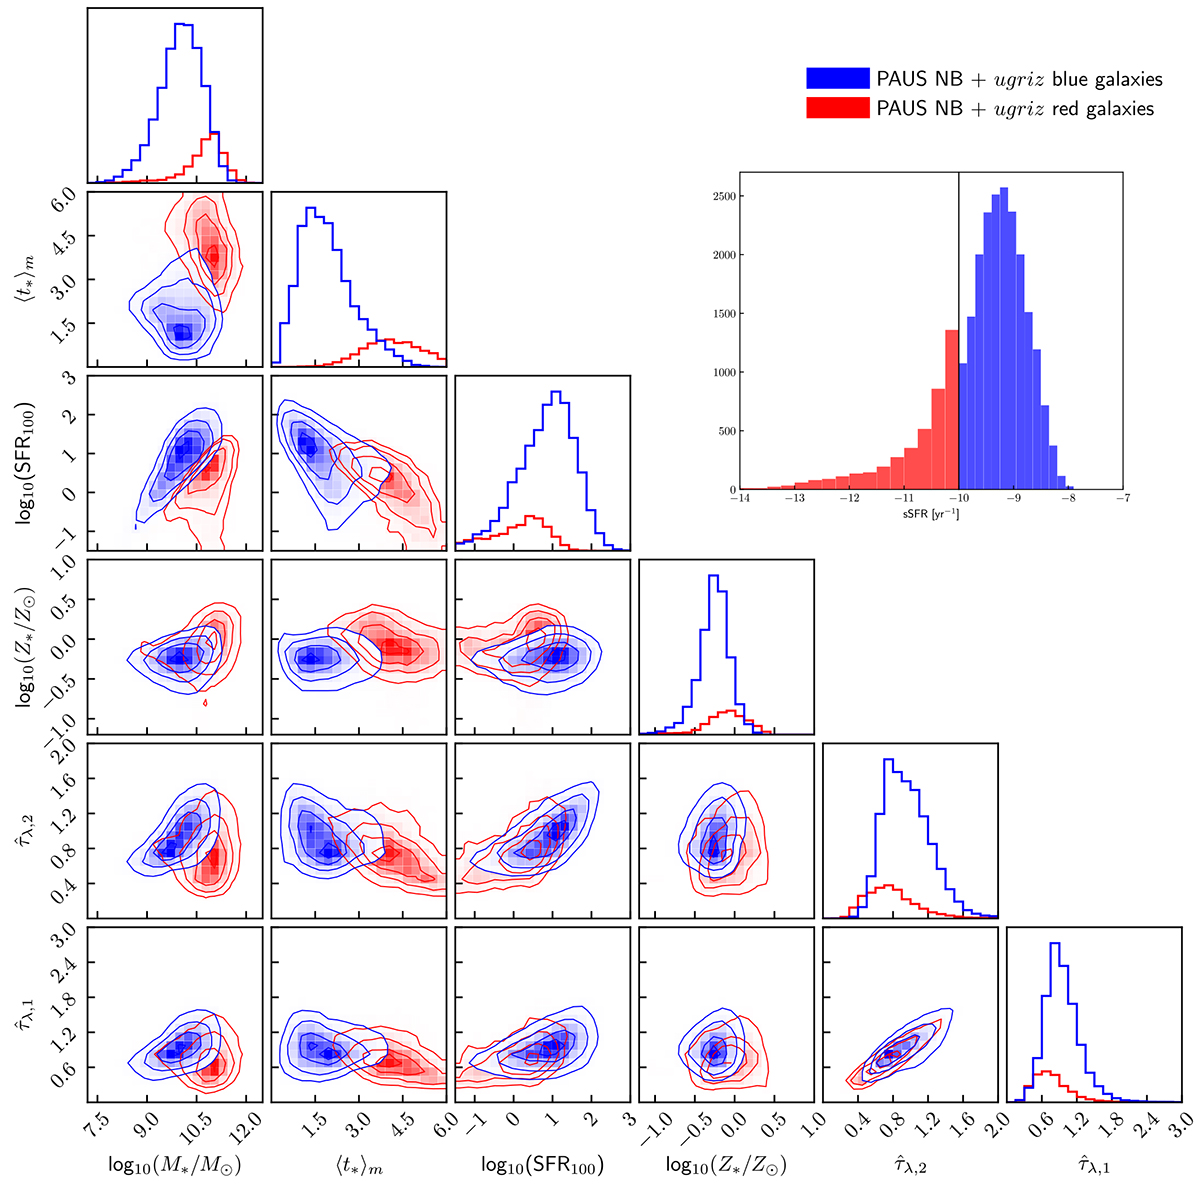
Download original image
Histogram of sSFR values estimated from CIGALE and corner plot of estimated properties. Blue contours and histograms indicate the main sequence of star forming galaxies, red depicts the red sequence of old galaxies The solid line in the histogram shows the cut at = 10−10 yr−1, separating the blue and red galaxy populations.
Current usage metrics show cumulative count of Article Views (full-text article views including HTML views, PDF and ePub downloads, according to the available data) and Abstracts Views on Vision4Press platform.
Data correspond to usage on the plateform after 2015. The current usage metrics is available 48-96 hours after online publication and is updated daily on week days.
Initial download of the metrics may take a while.