Fig. 3.
Download original image
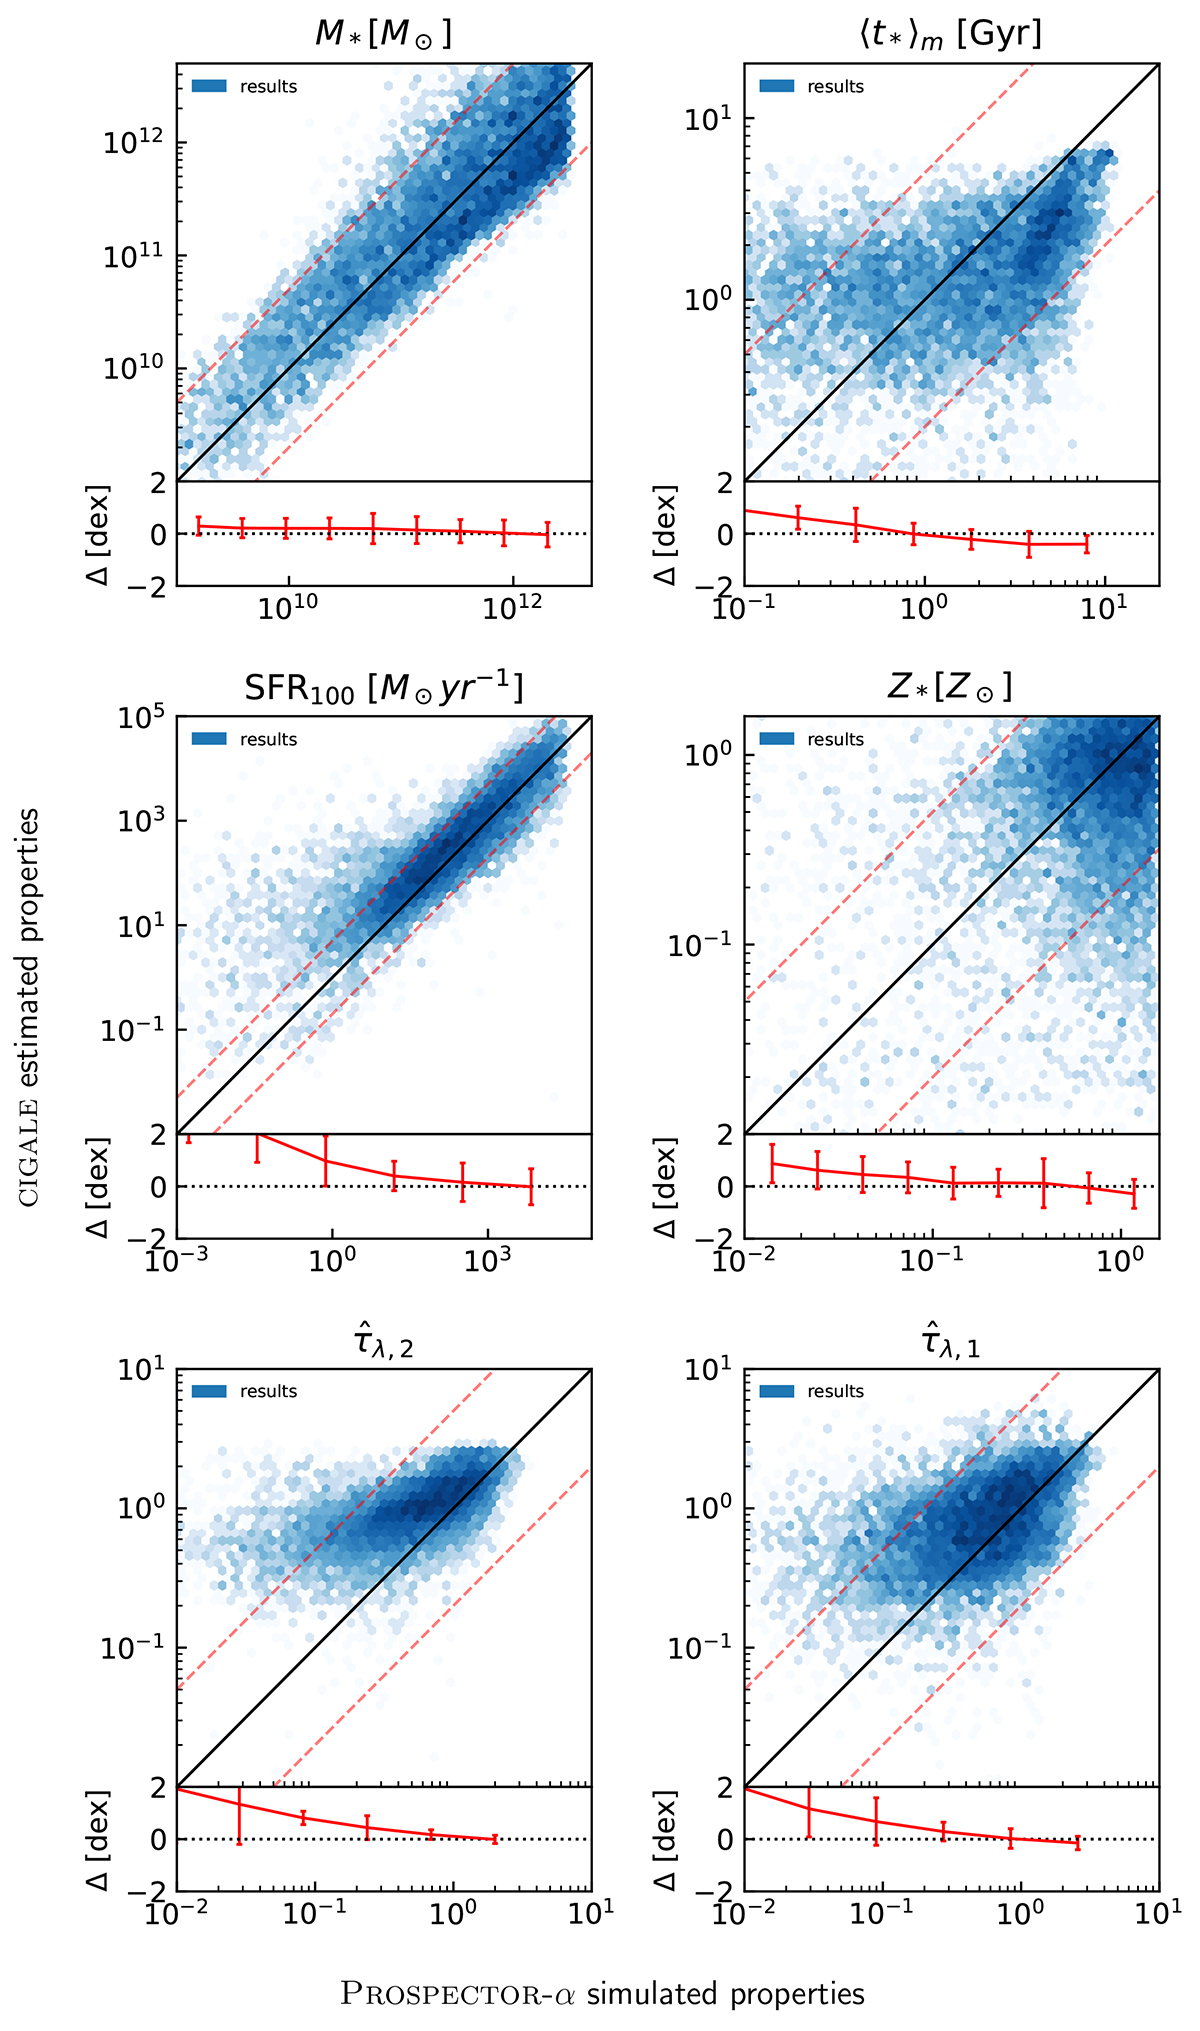
Hexbin plots showing the ground truth from the PROSPECTOR-α stellar population simulations on the x-axis versus the MAP value from the CIGALEχ2 analysis, for stellar mass M*, mean mass-weighted stellar ages ⟨t*⟩m, SFR over the last 100 Myrs, stellar metallicity Z* and the optical depths of the two-component dust attenuation model ![]() and
and ![]() . The red points and errorbars show the median and standard deviation for several bins. Below each panel, we show mean the residuals and their standard deviations over ten bins covering the parameter range.
. The red points and errorbars show the median and standard deviation for several bins. Below each panel, we show mean the residuals and their standard deviations over ten bins covering the parameter range.
Current usage metrics show cumulative count of Article Views (full-text article views including HTML views, PDF and ePub downloads, according to the available data) and Abstracts Views on Vision4Press platform.
Data correspond to usage on the plateform after 2015. The current usage metrics is available 48-96 hours after online publication and is updated daily on week days.
Initial download of the metrics may take a while.