Open Access
Fig. B.1.
Download original image
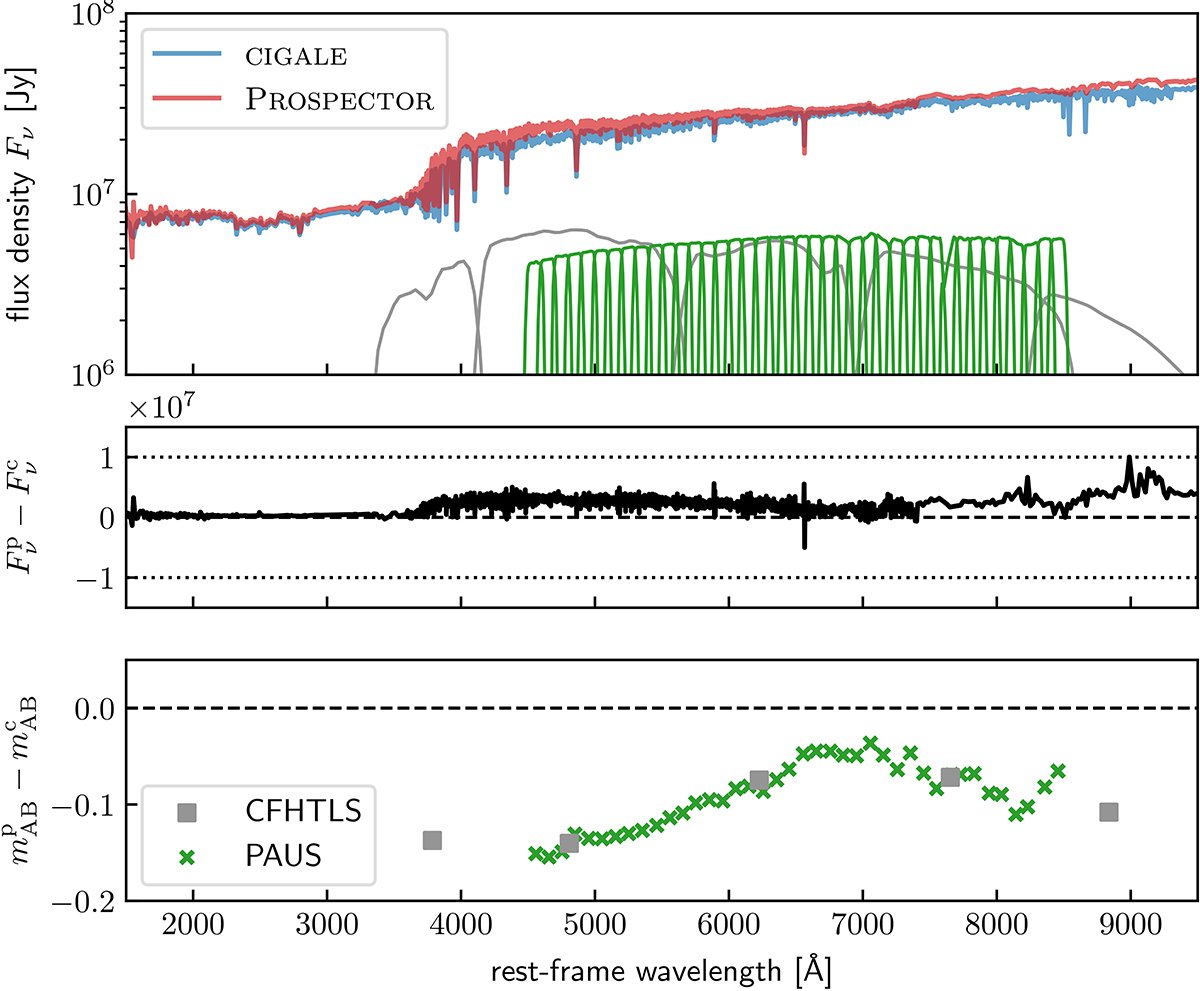
Comparison of rest-frame SED and magnitudes between BC03 (CIGALE) and MILES (PROSPECTOR). The uppermost panel shows the rest-frame spectra, with the residual between the curves plotted below. The lower plot illustrates the magnitude differences in the CFHTLS and PAUS filter bands extracted from both SED simulations.
Current usage metrics show cumulative count of Article Views (full-text article views including HTML views, PDF and ePub downloads, according to the available data) and Abstracts Views on Vision4Press platform.
Data correspond to usage on the plateform after 2015. The current usage metrics is available 48-96 hours after online publication and is updated daily on week days.
Initial download of the metrics may take a while.