Open Access
Fig. A.2.
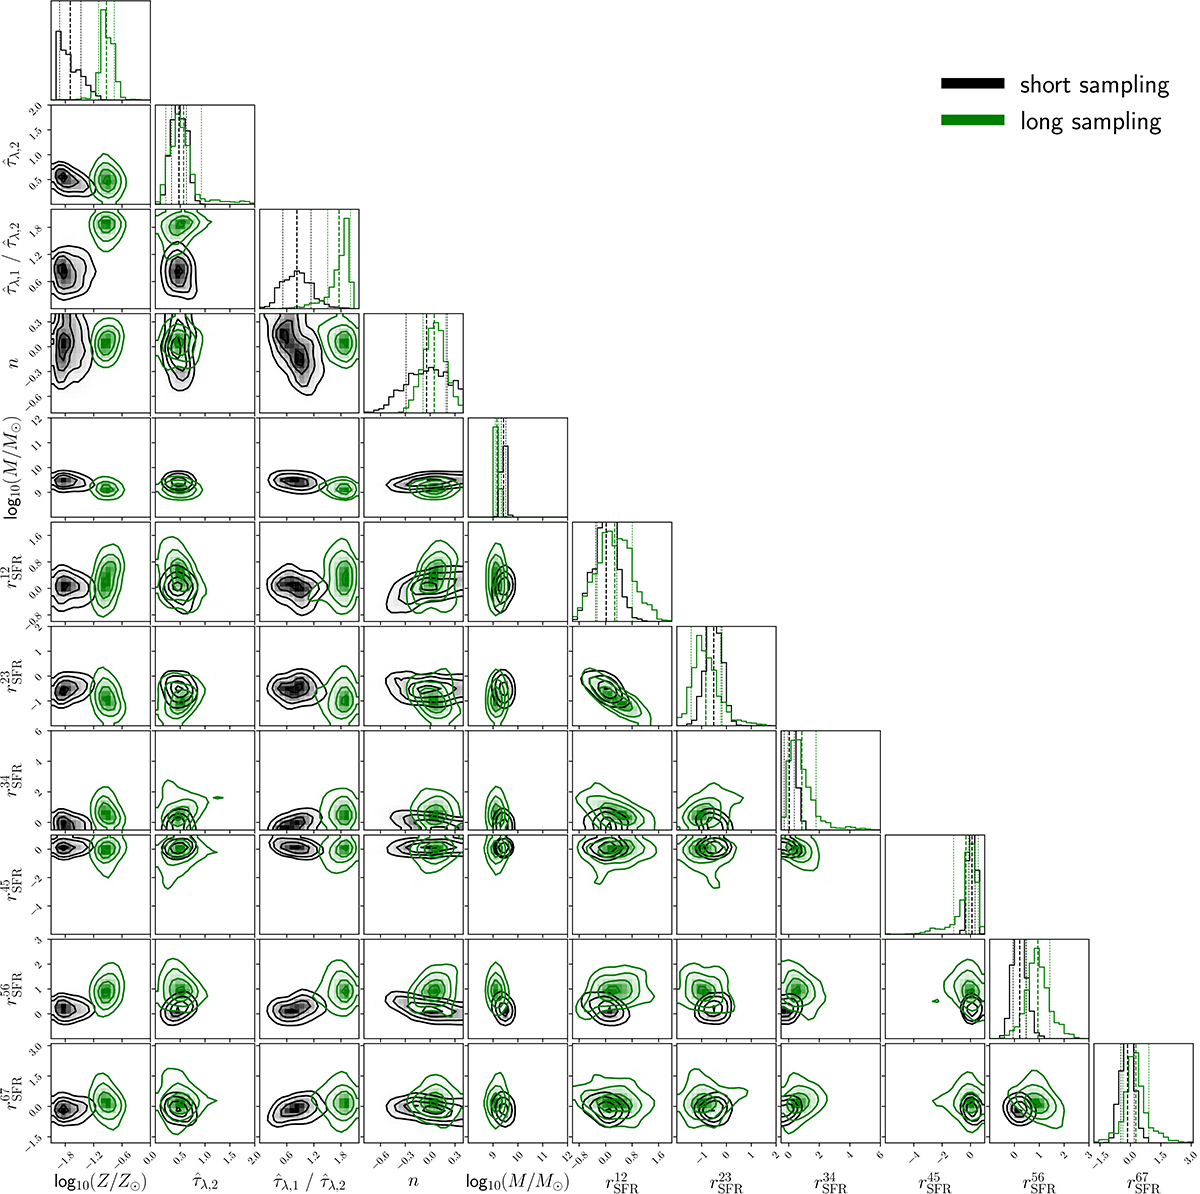
Download original image
Comparison of the posterior distributions depending on the overall number of likelihood calls. The gray contour show the posteriors of the shown properties with 2048 iteration and 48 walkers, while the green contours depict the results from another run with iterations walkers and 64 walkers.
Current usage metrics show cumulative count of Article Views (full-text article views including HTML views, PDF and ePub downloads, according to the available data) and Abstracts Views on Vision4Press platform.
Data correspond to usage on the plateform after 2015. The current usage metrics is available 48-96 hours after online publication and is updated daily on week days.
Initial download of the metrics may take a while.