Fig. 8
Download original image
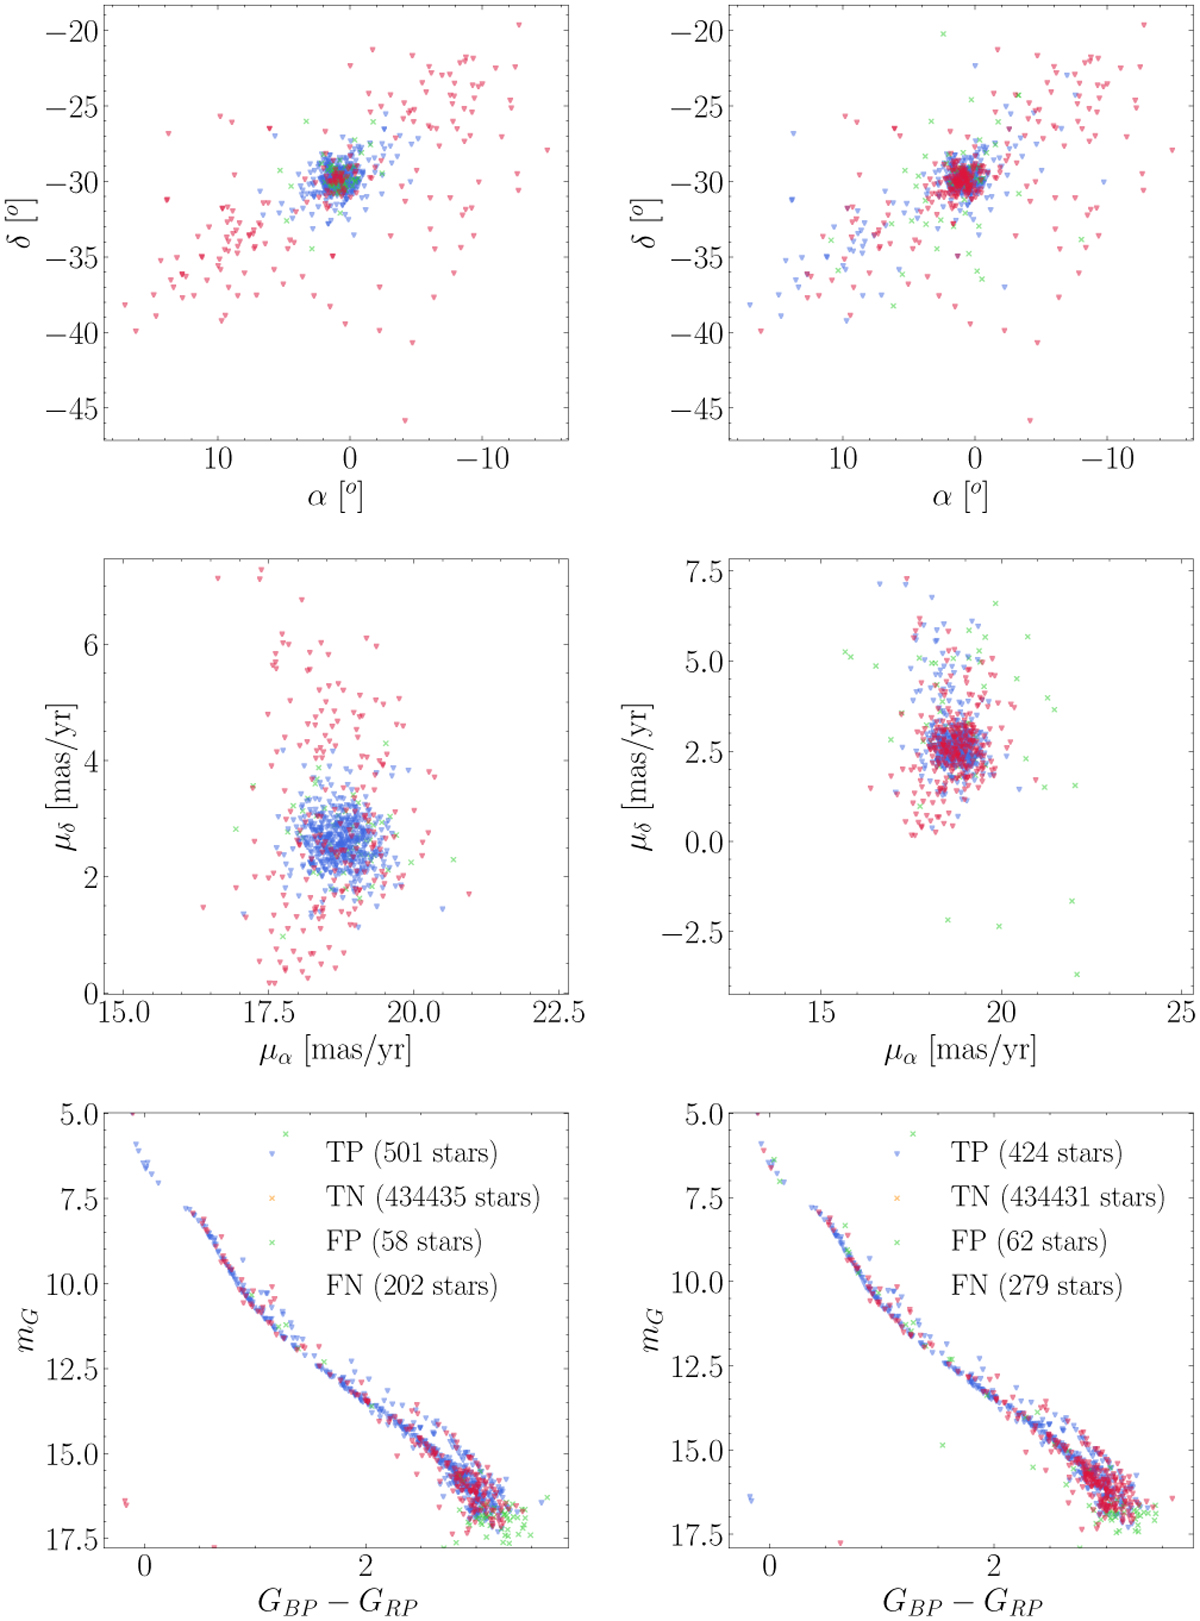
Classification results for individual stars for the models trained on N-body simulation (left panels) and the Pleiades (right panel) and tested on the Praesepe cluster. The top panel shows coordinates α and δ. The middle panels show proper motions in α and δ. The bottom panels show apparent magnitude and color. Due to their large number, the true negatives are not visualized in these plots.
Current usage metrics show cumulative count of Article Views (full-text article views including HTML views, PDF and ePub downloads, according to the available data) and Abstracts Views on Vision4Press platform.
Data correspond to usage on the plateform after 2015. The current usage metrics is available 48-96 hours after online publication and is updated daily on week days.
Initial download of the metrics may take a while.