Fig. 3
Download original image
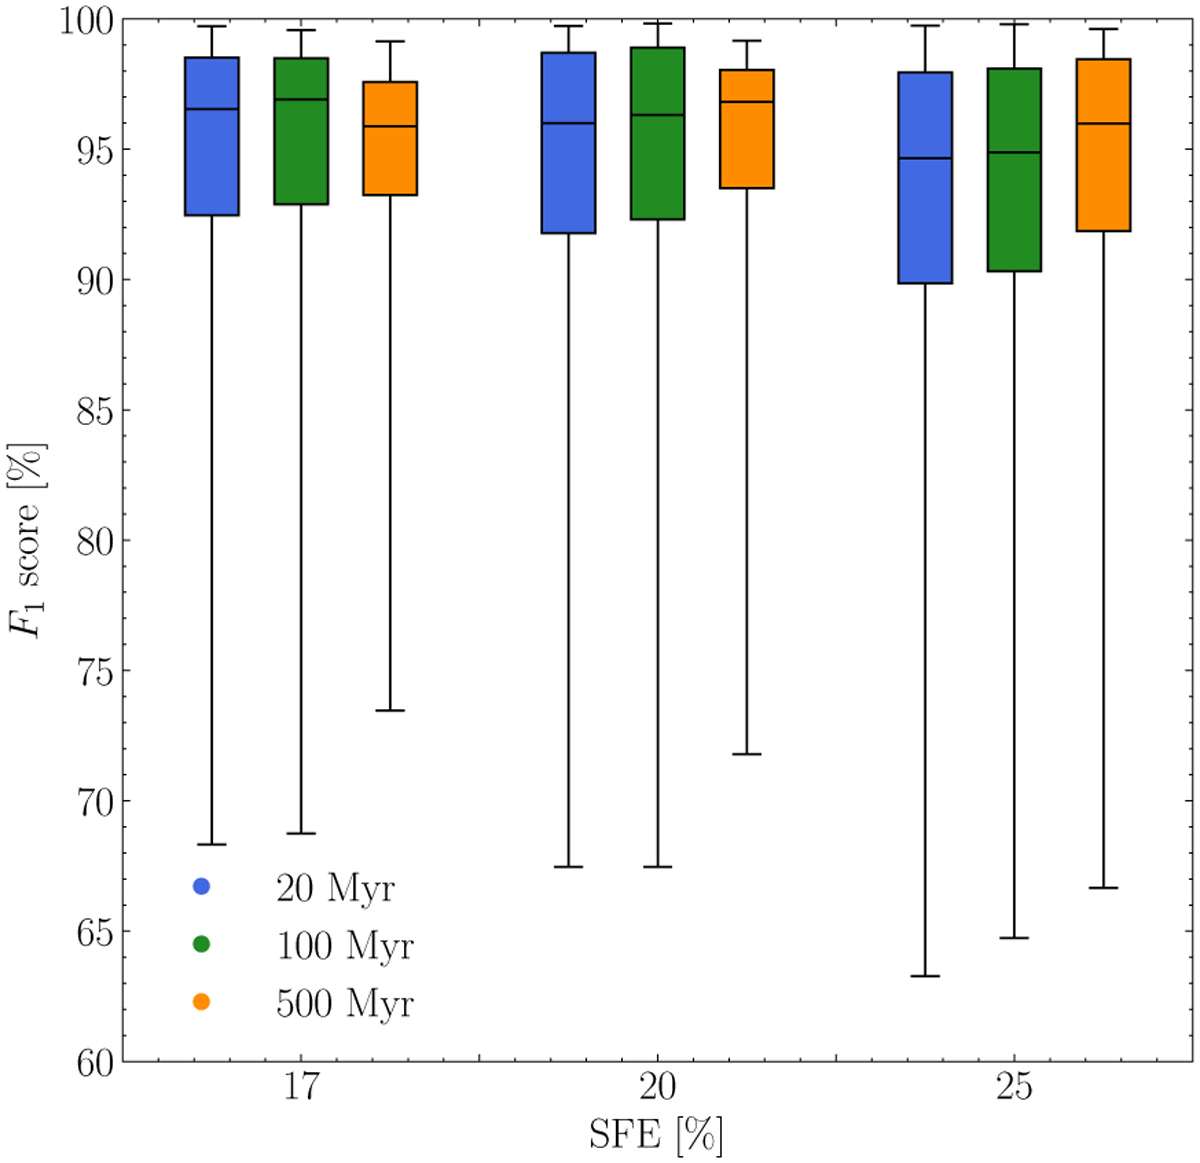
Box plots of F1 score as a function of SFE for different snapshots. The x-axis shows the SFE value of the training set. The color represents the snapshot time of the training sets. Each box plot shows the median, quantiles, minimum, and maximum values of the classification results on more than 1096 synthetic cluster datasets.
Current usage metrics show cumulative count of Article Views (full-text article views including HTML views, PDF and ePub downloads, according to the available data) and Abstracts Views on Vision4Press platform.
Data correspond to usage on the plateform after 2015. The current usage metrics is available 48-96 hours after online publication and is updated daily on week days.
Initial download of the metrics may take a while.