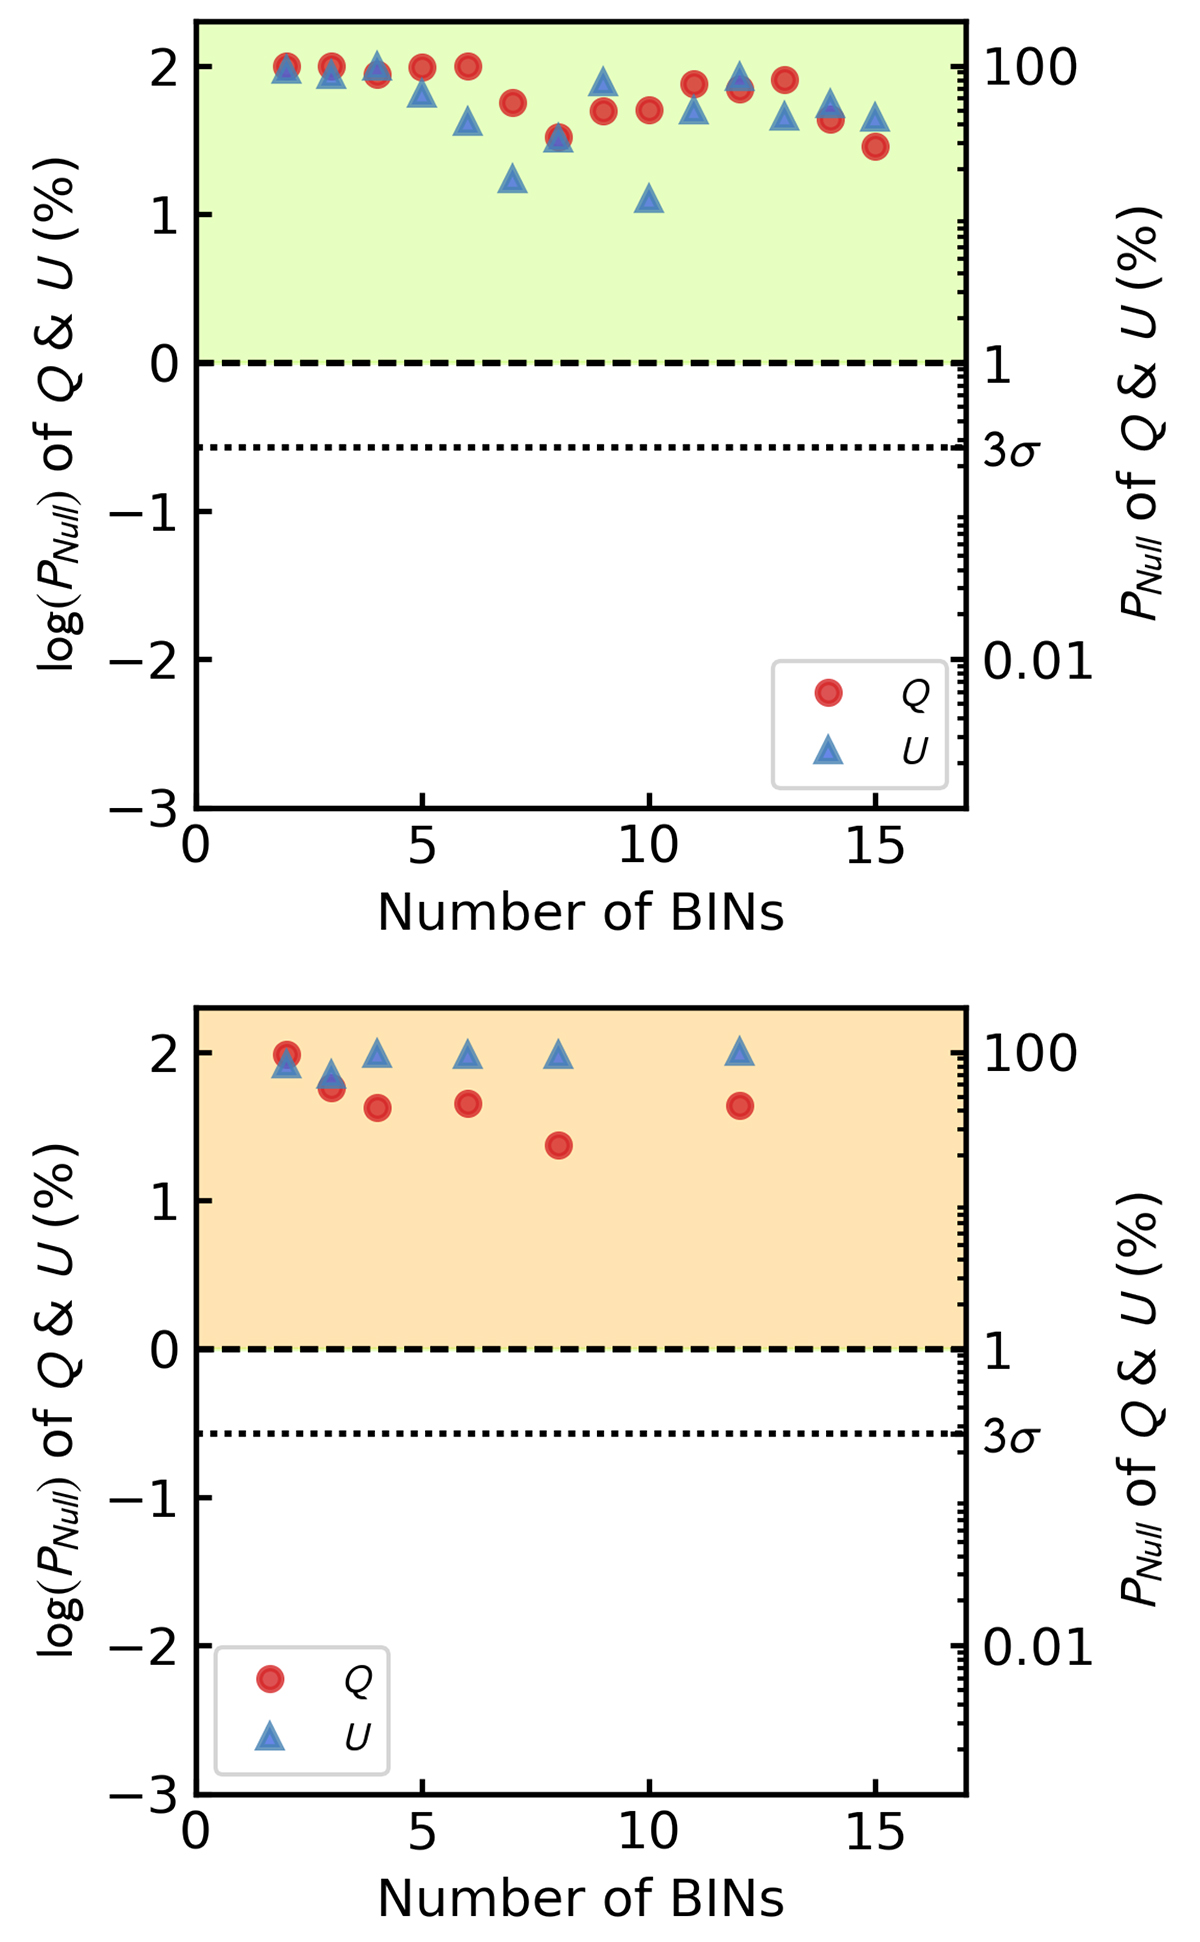
Fig. A.1.
Download original image
Null hypothesis probability of the chi-square test for the constant model on the normalized Q (red) and U (blue) Stokes parameters for different time (top panel) and energy (bottom panel) binning cases. The left and right vertical axes in each panel show the percentage of the probability values on a logarithmic and linear scale, respectively. The shaded green and orange areas indicate the 1% threshold level. The dashed and dotted black lines in the middle of each panel represent the 1% and 3σ (99.73%) probability levels, respectively.
Current usage metrics show cumulative count of Article Views (full-text article views including HTML views, PDF and ePub downloads, according to the available data) and Abstracts Views on Vision4Press platform.
Data correspond to usage on the plateform after 2015. The current usage metrics is available 48-96 hours after online publication and is updated daily on week days.
Initial download of the metrics may take a while.