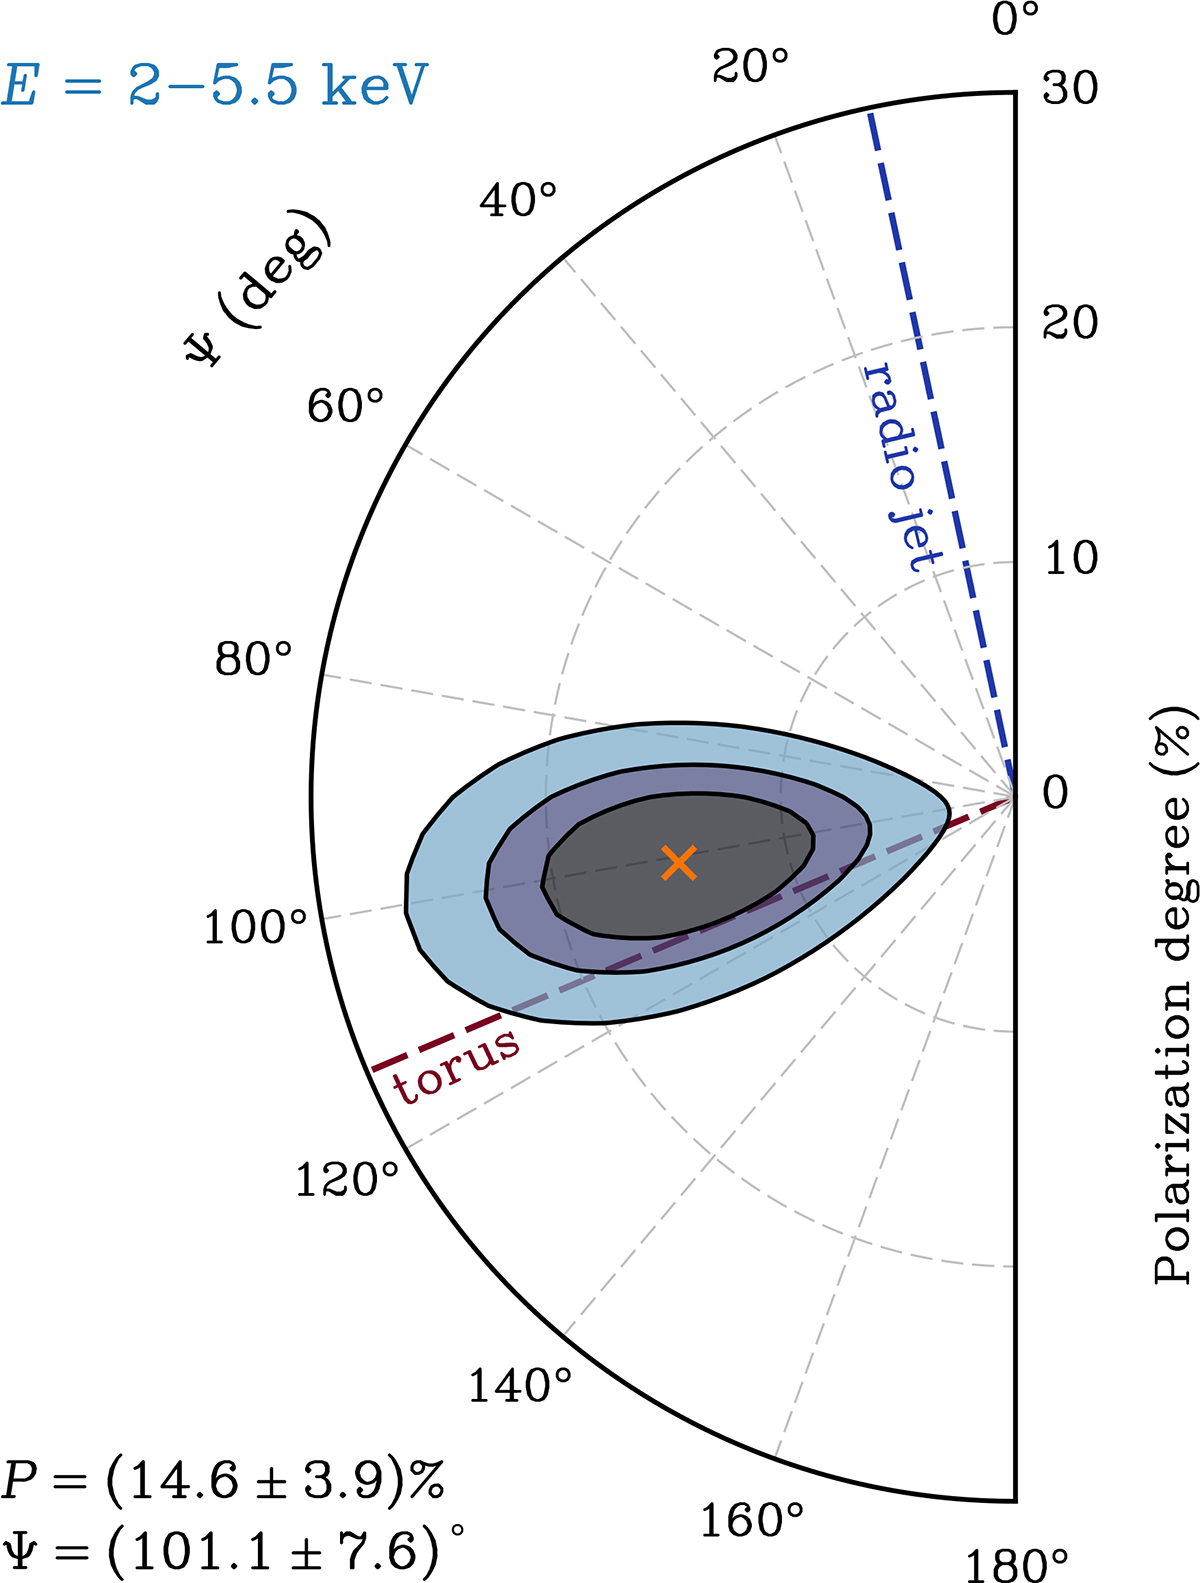
Fig. 2.
Download original image
Contour plot of the polarization angle vs. polarization degree accounting for the 68%, 90%, and 99% confidence levels, computed by taking into account the IXPE I, Q, and U spectra in the 2–5.5 keV band (the energy band with the highest significance in terms of polarization detection). The orange cross indicates the best-fit values of P and Ψ, which are also reported in the lower left corner. The dashed blue line describes the direction of the parsec-scale radio jet (Wilson & Ulvestad 1983). The dashed brown line indicates the orientation of the molecular torus derived by García-Burillo et al. (2019) with ALMA (see Sect. 4.1).
Current usage metrics show cumulative count of Article Views (full-text article views including HTML views, PDF and ePub downloads, according to the available data) and Abstracts Views on Vision4Press platform.
Data correspond to usage on the plateform after 2015. The current usage metrics is available 48-96 hours after online publication and is updated daily on week days.
Initial download of the metrics may take a while.