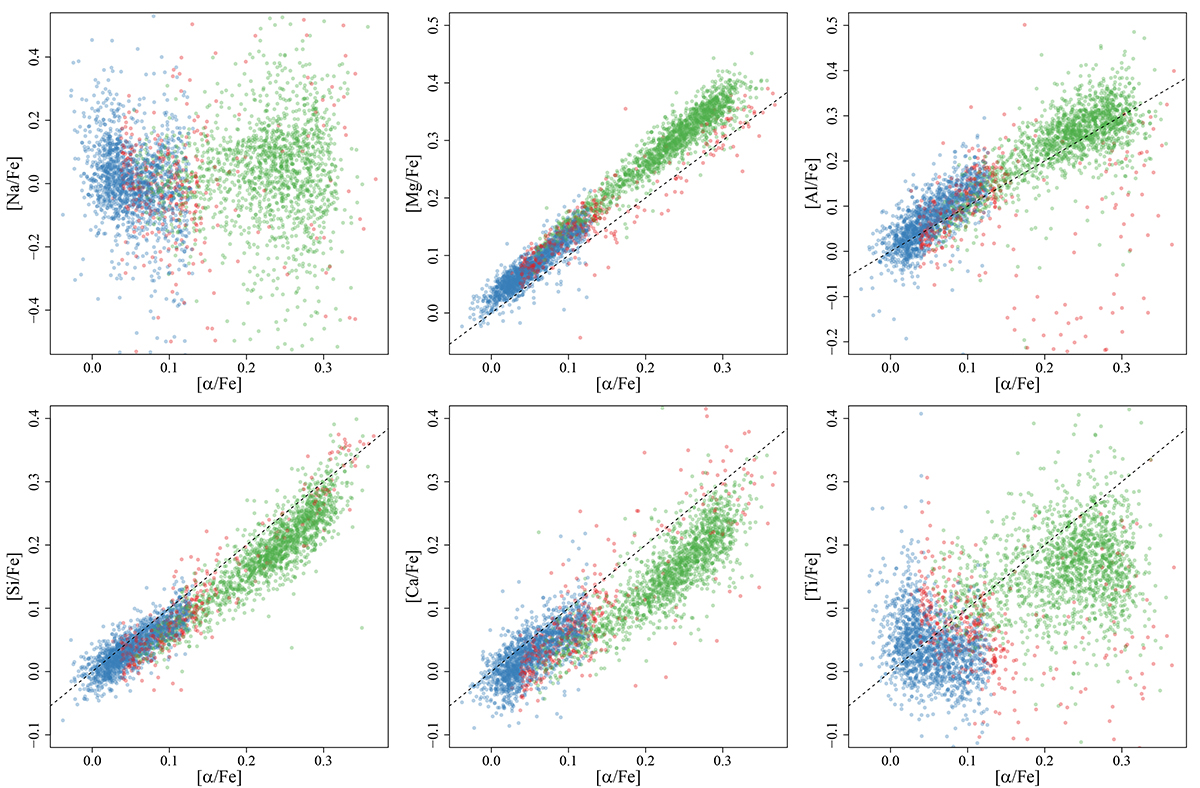
Fig. 1.
Download original image
Element abundances vs [α/Fe] in the selected RGB sample. The colours in the scatter plots correspond to the groups identified in the APO-K2 catalogue (green = high-α population, blue = low-α population, red = intermediate group). The dashed lines serve as visual aids, highlighting the trend of different elements when assuming the α-enhancement from Asplund et al. (2009) solar mixture as in Eq. (2).
Current usage metrics show cumulative count of Article Views (full-text article views including HTML views, PDF and ePub downloads, according to the available data) and Abstracts Views on Vision4Press platform.
Data correspond to usage on the plateform after 2015. The current usage metrics is available 48-96 hours after online publication and is updated daily on week days.
Initial download of the metrics may take a while.