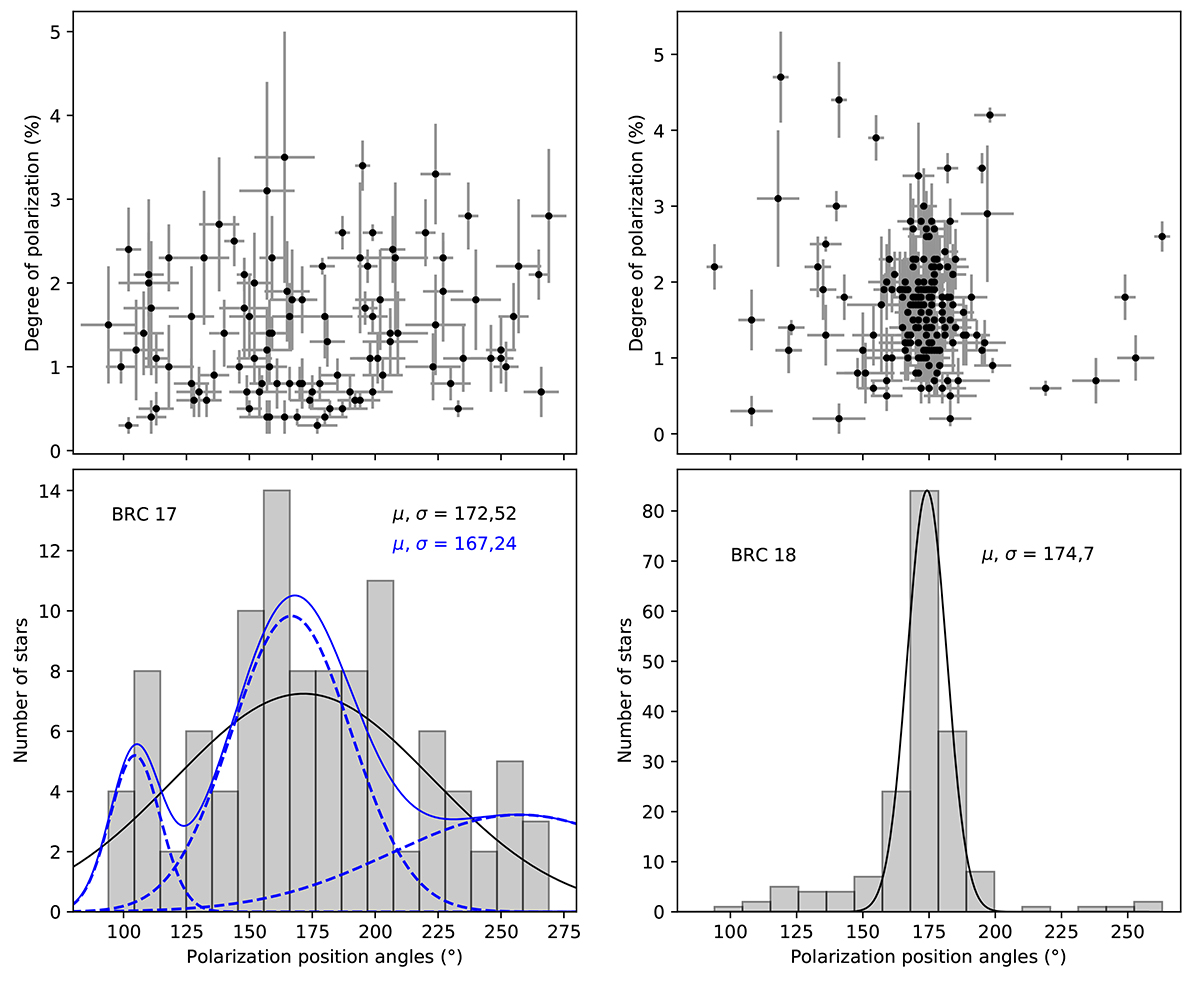
Fig. 6.
Download original image
Degree of polarization vs. the polarization position angle of stars projected on BRC 17 (left panel) and BRC 18 (right panel). The histogram of the position angles is also shown. These values are obtained after subtracting the foreground interstellar component from the observed values. The solid black curves represent a fit to the histogram of the position angles using a single Gaussian model. BRC 17 is also fit with a multiple Gaussian model (solid blue), where decomposed Gaussians are shown in dashed blue, and the mean and standard deviation of the central Gaussian are marked.
Current usage metrics show cumulative count of Article Views (full-text article views including HTML views, PDF and ePub downloads, according to the available data) and Abstracts Views on Vision4Press platform.
Data correspond to usage on the plateform after 2015. The current usage metrics is available 48-96 hours after online publication and is updated daily on week days.
Initial download of the metrics may take a while.