Open Access
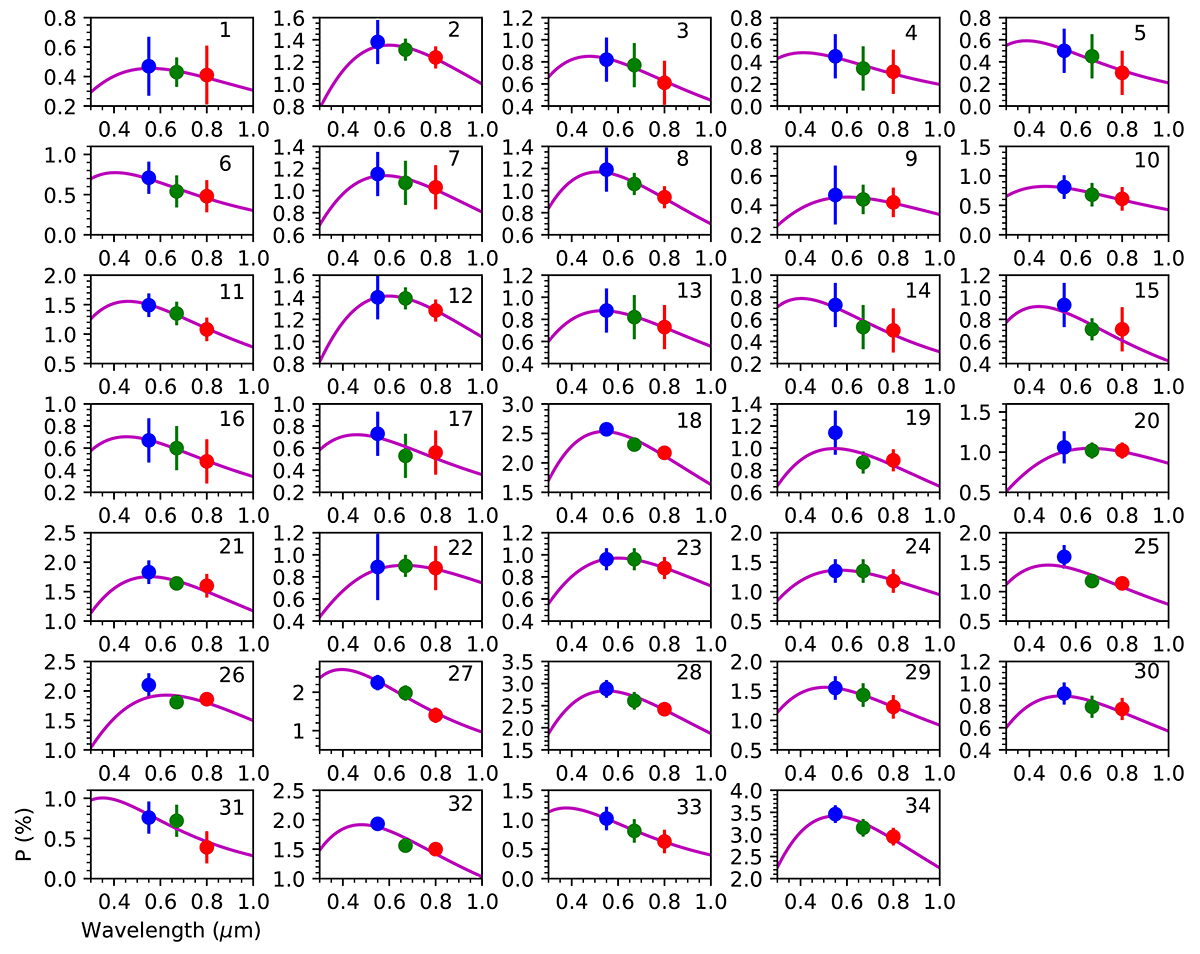
Fig. 4.
Download original image
Serkowski curve for 34 bright Tycho stars observed in the VRI filters. The filled blue, green, and red circles correspond to the V, R, and I bands, respectively. The solid magenta line represents the fitting using the Serkowski law (Serkowski et al. 1975).
Current usage metrics show cumulative count of Article Views (full-text article views including HTML views, PDF and ePub downloads, according to the available data) and Abstracts Views on Vision4Press platform.
Data correspond to usage on the plateform after 2015. The current usage metrics is available 48-96 hours after online publication and is updated daily on week days.
Initial download of the metrics may take a while.