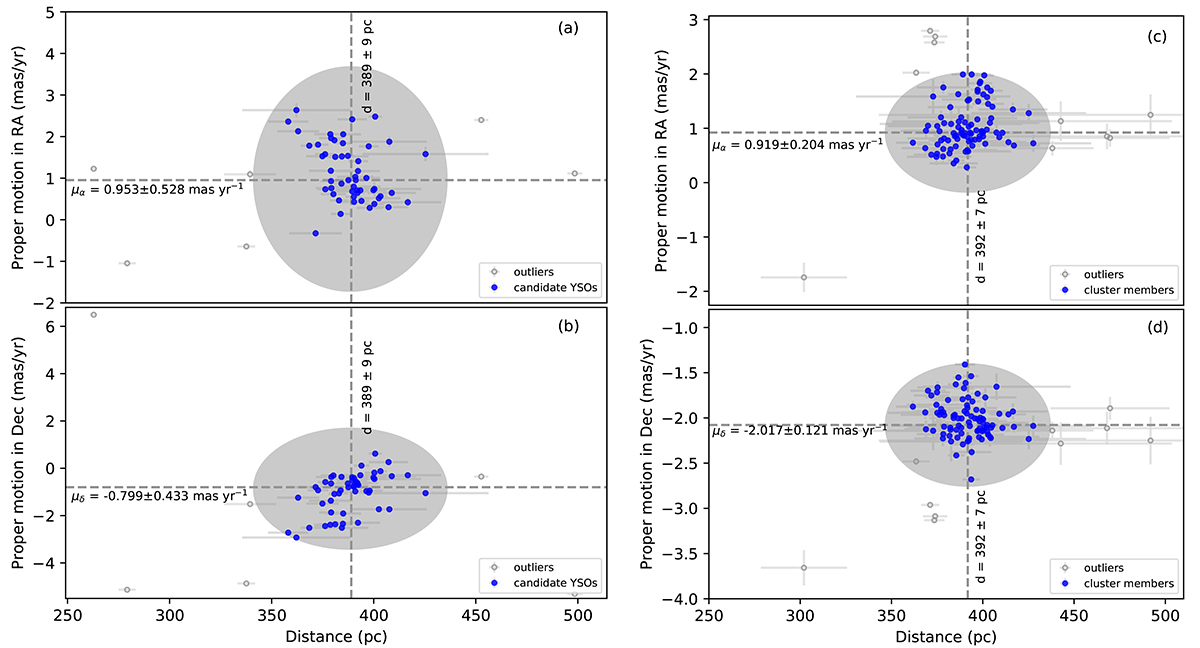
Fig. 1.
Download original image
Proper motion values of the known candidate YSOs associated with BRC 17 (left panel) and the known probable cluster members associated with Collinder 69 (right panel) plotted as a function of their distances obtained from Gaia EDR3. Panels a and c: μα vs. d plot of the sources. The candidate YSOs and cluster members lying within a 5 × MAD boundary in the μα vs. d plot are plotted using filled blue circles, and the outliers are plotted using open gray circles. The dashed lines indicate the median values of μα and d of the candidate YSOs and cluster members. Panels b and d: μδ vs. d plot of the sources. The gray shaded ellipses show the 5 × MAD boundary range in distance and proper motions within which the sources are used to estimate a distance. The candidate YSOs and cluster members lying within the 5 × MAD boundary in the μδ vs. d plot are plotted using filled blue circles, and the outliers are plotted using open gray circles. The dashed lines indicate the median values of d and μδ of the candidate YSOs and cluster members.
Current usage metrics show cumulative count of Article Views (full-text article views including HTML views, PDF and ePub downloads, according to the available data) and Abstracts Views on Vision4Press platform.
Data correspond to usage on the plateform after 2015. The current usage metrics is available 48-96 hours after online publication and is updated daily on week days.
Initial download of the metrics may take a while.