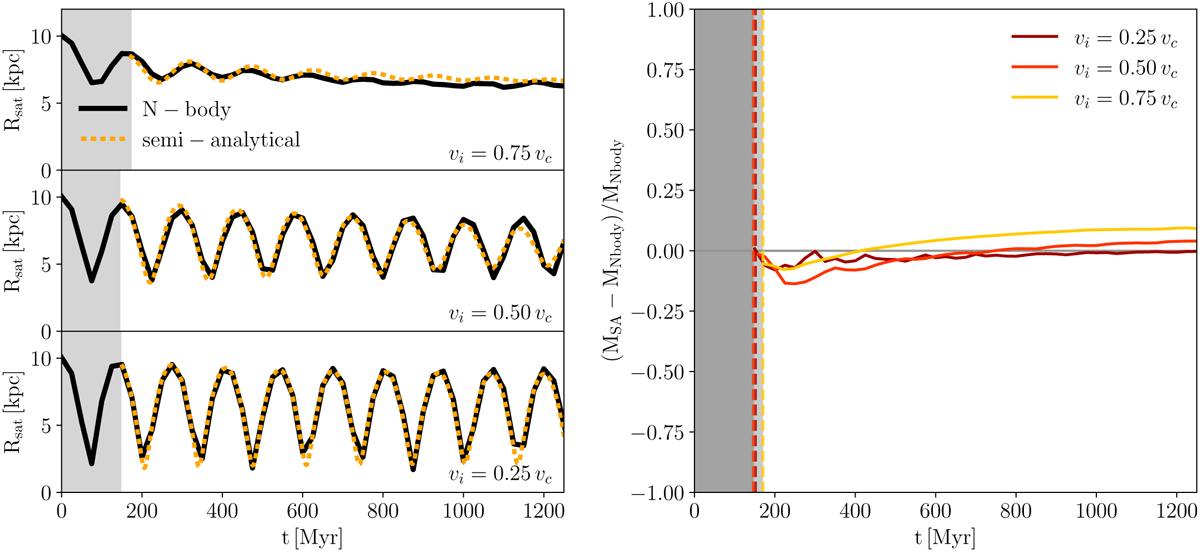
Fig. 7
Download original image
Comparison between the outcomes of N-body simulations and our semi-analytical model in systems with DF. Left panels: comparison between the evolution of the satellite’s CoM in both N-body simulations and semi-analytical models, each using the best value for α. The different panels correspond to the three different initial satellite’s velocities, vi = 0.75vc, vi = 0.50vc and vi = 0.25vc from top to bottom. The thick dotted orange line refers to the semi-analytical model, while the thick solid black line shows the result of the N-body simulations. Right panel: relative error in the evaluation of the satellite mass for the same values of the initial velocities as a function of time. Different line colours indicate different initial satellite velocities. The dashed vertical lines represent the initial time of the semi-analytical models, which corresponds to the first apocentre, and are coloured using the same colour code employed for the solid lines.
Current usage metrics show cumulative count of Article Views (full-text article views including HTML views, PDF and ePub downloads, according to the available data) and Abstracts Views on Vision4Press platform.
Data correspond to usage on the plateform after 2015. The current usage metrics is available 48-96 hours after online publication and is updated daily on week days.
Initial download of the metrics may take a while.