Fig. 6
Download original image
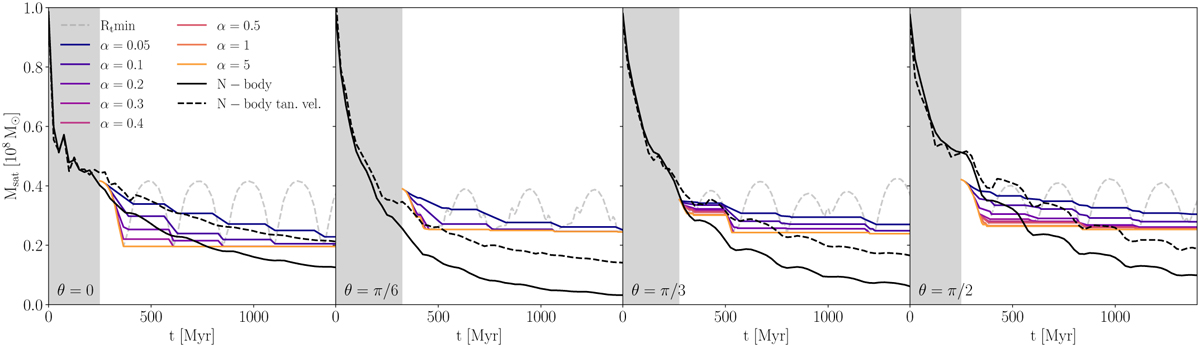
Satellite mass as a function of time for systems with the re-orientation of the satellite star velocities at the apocentres. The four panels refer to different orbital inclinations, from θ = 0 (leftmost panel) to θ = π/2 (rightmost panel). The dashed black line represents the satellite mass obtained through the new N-body simulations, compared with the outcome of the original N-body simulations shown as a solid black line. The coloured lines indicate the predictions of our semi-analytical model for various values of α. The dashed grey line represents the mass predicted using the minimum tidal radius evaluated along the 1000 different directions – if let free to increase.
Current usage metrics show cumulative count of Article Views (full-text article views including HTML views, PDF and ePub downloads, according to the available data) and Abstracts Views on Vision4Press platform.
Data correspond to usage on the plateform after 2015. The current usage metrics is available 48-96 hours after online publication and is updated daily on week days.
Initial download of the metrics may take a while.