Fig. 5
Download original image
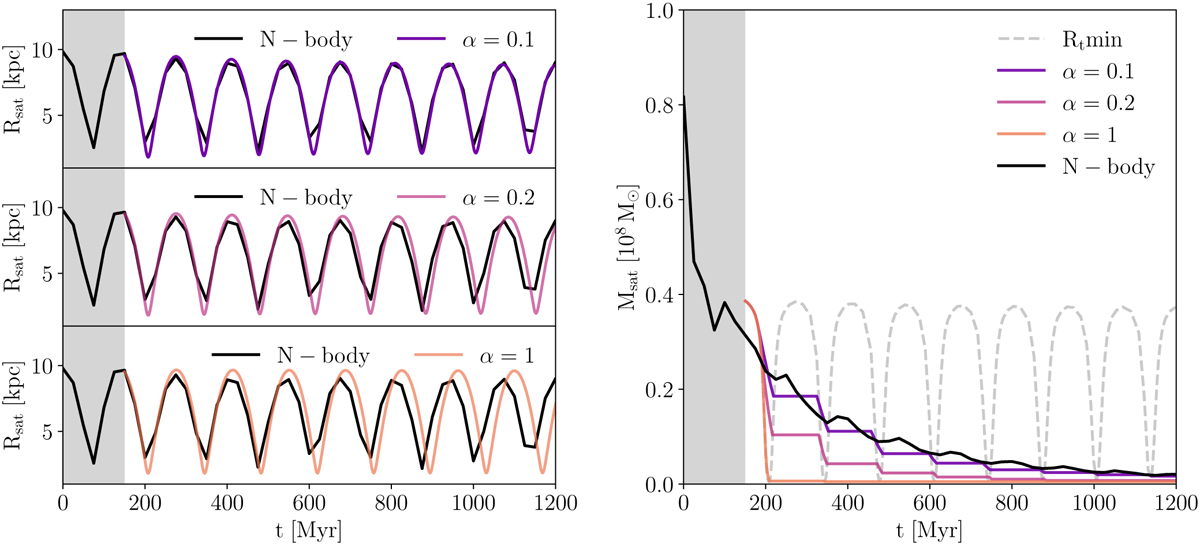
Orbital and mass evolution of a satellite when the effect of DF is included. Left panels: time-evolution of the satellite’s distance from the centre of the host in the N-body simulation (black lines) compared to our semi-analytical model’s predictions (solid coloured lines). From top to bottom, each panel refers to different values of α: 0.1, 0.2, and 1, respectively. Right panel: mass evolution of the satellite in both N-body simulations and semi-analytical models, maintaining the same colour code as in the left panels. The dashed grey line represents the mass predicted using the minimum tidal radius evaluated along the 1000 different directions – if let free to increase.
Current usage metrics show cumulative count of Article Views (full-text article views including HTML views, PDF and ePub downloads, according to the available data) and Abstracts Views on Vision4Press platform.
Data correspond to usage on the plateform after 2015. The current usage metrics is available 48-96 hours after online publication and is updated daily on week days.
Initial download of the metrics may take a while.