Fig. 4
Download original image
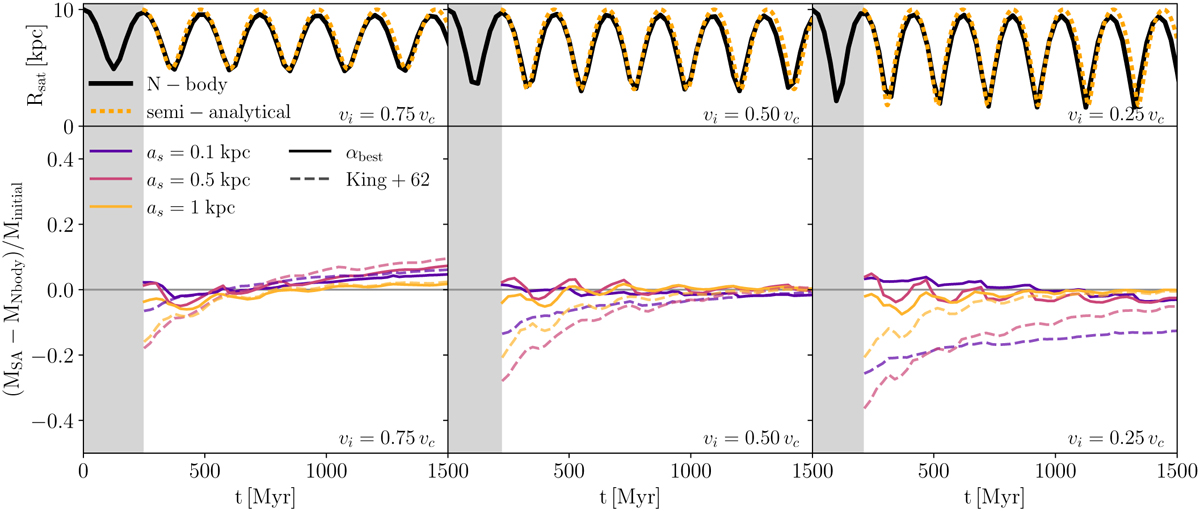
Results obtained for systems hosing satellites orbiting within the galactic plane without DF. The three panels refers to different initial velocities for the satellite CoM, vi = 0.75, vi = 0.5 and vi = 0.25 form left to right. Upper panels: separation of the satellite CoM from the primary galaxy centre as a function of time. The thick dotted orange line refers to the semi-analytical model, while the thick solid black line shows the result of the N-body simulations. Bottom panels: time evolution of the difference between the satellite mass predicted by the semi-analytical model and the mass resulting from N-body simulations, normalised to the initial satellite mass. The line colours indicate different satellite scale radii. The solid lines refer to our new semi-analytical prescription for the evolution of the satellite mass, whereas the dashed lines represent the results we obtain using King’s formula for the tidal radius. In both panels, the grey area indicates the time interval leading to the first apocentre.
Current usage metrics show cumulative count of Article Views (full-text article views including HTML views, PDF and ePub downloads, according to the available data) and Abstracts Views on Vision4Press platform.
Data correspond to usage on the plateform after 2015. The current usage metrics is available 48-96 hours after online publication and is updated daily on week days.
Initial download of the metrics may take a while.