Fig. 2
Download original image
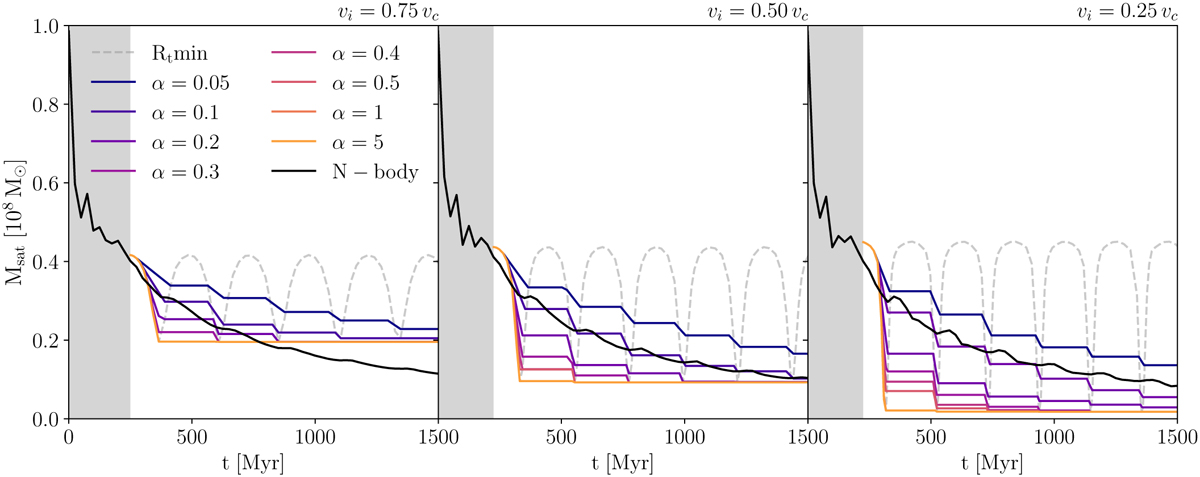
Evolution of the satellite mass as a function of time for three cases with as = 0.5 kpc, orbiting within the host galactic plane and with different initial velocities (vi/vc = 0.75, 0.5, 0.25, from left to right). The black line shows the evolution of the mass according to the N-body simulations. The solid coloured lines correspond to the mass evolution predicted by the semi-analytical model with different values for α, spanning the range [0.05 − 5]. The dashed grey line represents the mass predicted using the minimum tidal radius evaluated along the 1000 different directions – if let free to increase –, whereas the grey region represents the time from the beginning of the N-body simulation to the first apocentre, which is the starting point for the semi-analytical models.
Current usage metrics show cumulative count of Article Views (full-text article views including HTML views, PDF and ePub downloads, according to the available data) and Abstracts Views on Vision4Press platform.
Data correspond to usage on the plateform after 2015. The current usage metrics is available 48-96 hours after online publication and is updated daily on week days.
Initial download of the metrics may take a while.