Fig. 1
Download original image
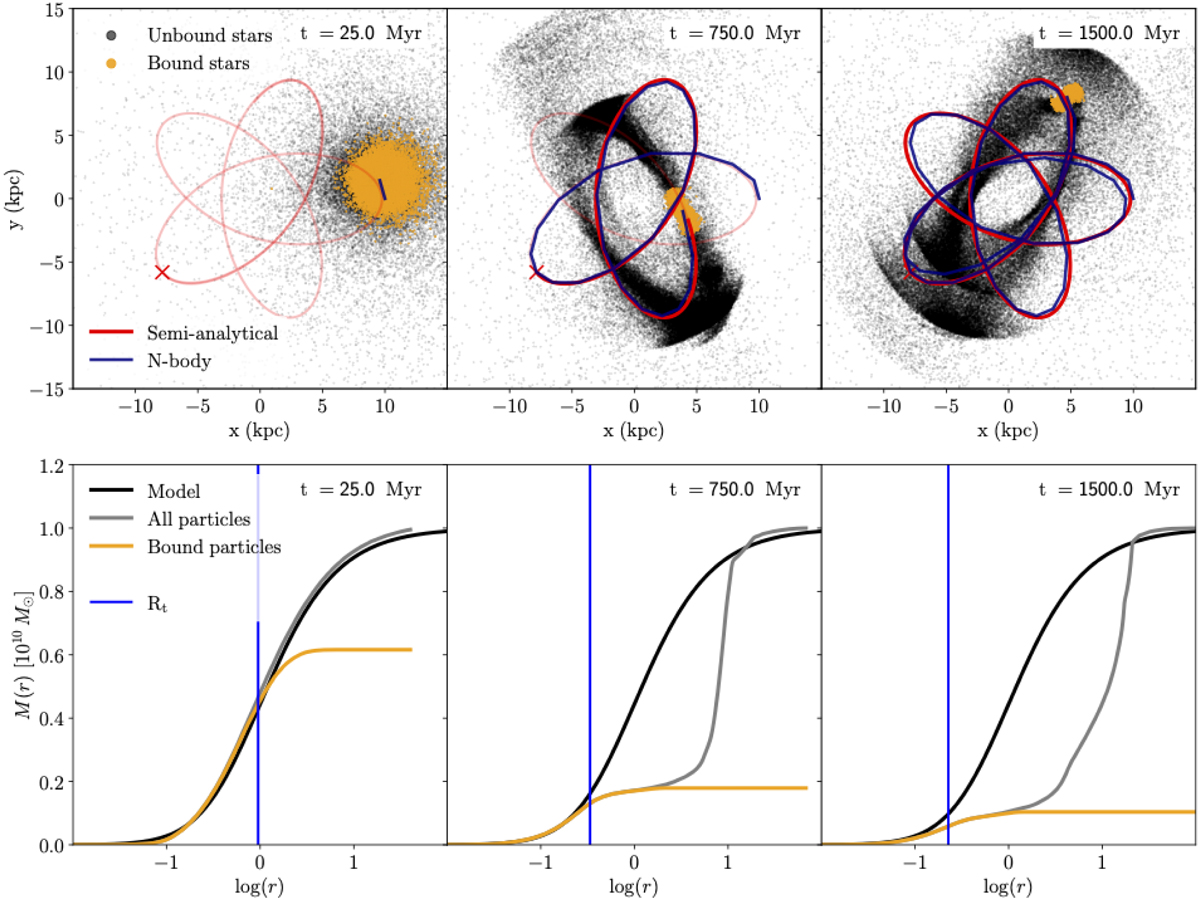
Example of the satellite orbital and mass evolution. Upper panels: satellite particles of an example run featuring a satellite with as = 0.5 kpc, orbiting in the galactic plane of an exponential disc host, with initial velocity vi = 0.5 vc. From left to right, the three panels correspond to the first, middle, and final snapshot of the simulation. The origin coincides with the centre of the host galaxy potential. The colours indicate which particles are bound to the satellite (orange) or unbound (grey). The shaded red line shows the trajectory predicted by the semi-analytical model, while the solid red and blue lines track the satellite CoM, in the semi-analytical model and in the N-body simulation, respectively. Finally, the red cross indicates the initial point for the semi-analytical orbital integration, corresponding to the first apocentre. Lower panels: satellite cumulative mass profiles at the same snapshots and for the same system as in the upper panels. The solid black curve displays the theoretical cumulative mass profile from the Hernquist model. The other two profiles are constructed using the bound particles only (in orange) and all the particles that were part of the satellite at the initial time (in grey). The vertical blue line shows the value of the tidal radius computed with our semi-analytical prescription.
Current usage metrics show cumulative count of Article Views (full-text article views including HTML views, PDF and ePub downloads, according to the available data) and Abstracts Views on Vision4Press platform.
Data correspond to usage on the plateform after 2015. The current usage metrics is available 48-96 hours after online publication and is updated daily on week days.
Initial download of the metrics may take a while.