Fig. 6
Download original image
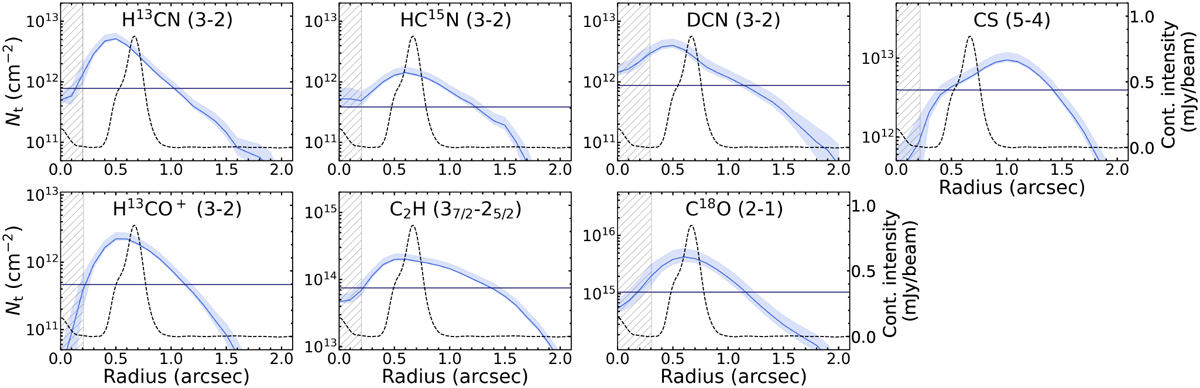
Radial profiles of the column density for the observed molecules. The solid blue lines refer to the value extracted for an excitation temperature of Tex = 30 K, while the ribbons show the uncertainty, which takes into account the propagated uncertainty on the flux density and the systematic uncertainty on the excitation temperature, which has been varied between 20 and 50 K (Facchini et al. 2021). The 10% absolute flux calibration uncertainty is not included. The horizontal dark blue line shows the disk-averaged value, listed in Table 2. The dashed black line shows the azimuthally averaged radial profile of the 855μm continuum emission (Isella et al. 2019). Hatched regions indicate the beam major axis of the cubes.
Current usage metrics show cumulative count of Article Views (full-text article views including HTML views, PDF and ePub downloads, according to the available data) and Abstracts Views on Vision4Press platform.
Data correspond to usage on the plateform after 2015. The current usage metrics is available 48-96 hours after online publication and is updated daily on week days.
Initial download of the metrics may take a while.