Fig. 4
Download original image
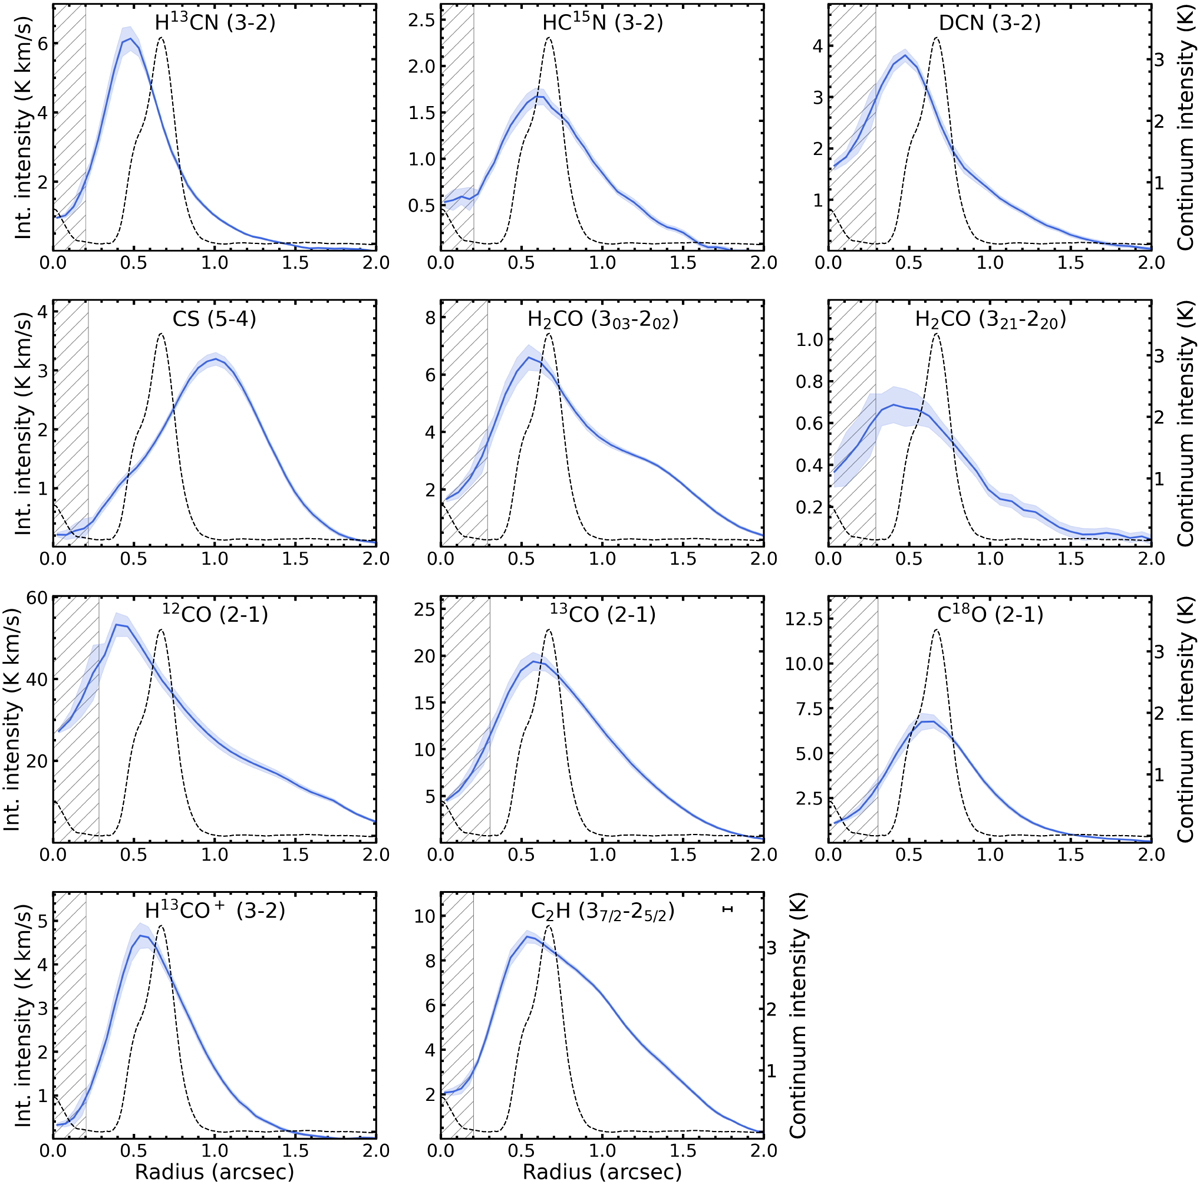
Azimuthally averaged radial profiles of the integrated intensity for the analyzed molecular transitions. The ribbons show the standard deviation across each annulus, divided by the square root of the number of independent beams. The FWHM of the synthesized beam is highlighted by the hatched region, while the beam size of the continuum image is indicated on the top-right corner of the last panel. The dashed black line shows the azimuthally averaged radial profile of the 855 μm continuum emission (Isella et al. 2019).
Current usage metrics show cumulative count of Article Views (full-text article views including HTML views, PDF and ePub downloads, according to the available data) and Abstracts Views on Vision4Press platform.
Data correspond to usage on the plateform after 2015. The current usage metrics is available 48-96 hours after online publication and is updated daily on week days.
Initial download of the metrics may take a while.