Fig. B.1
Download original image
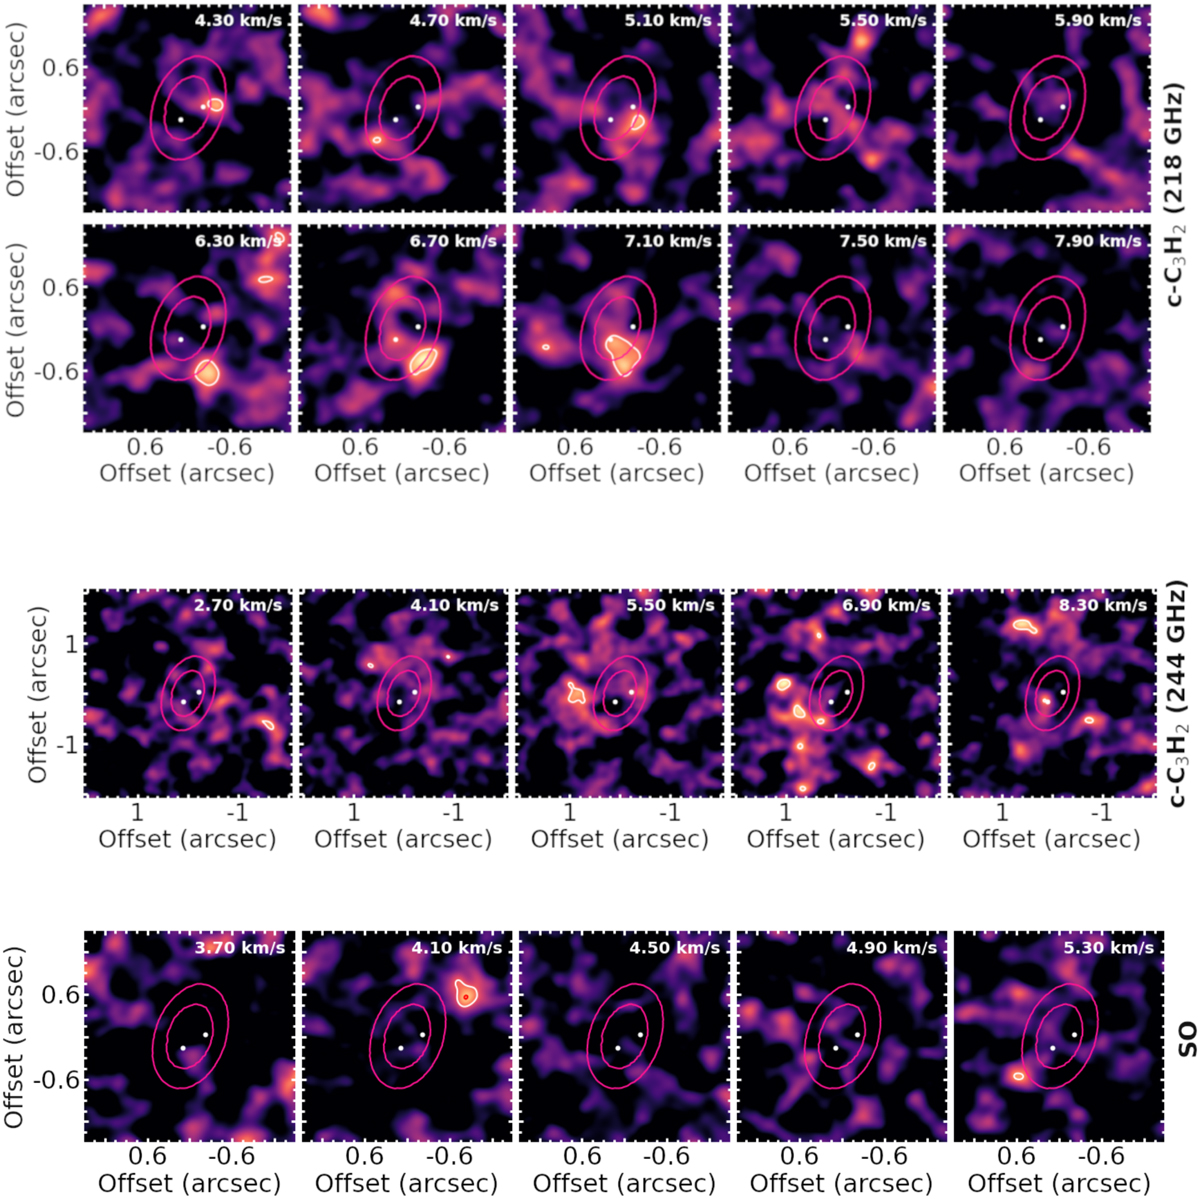
Channel maps of c-C3H2 (218 GHz, top row), c-C3H2 (244 GHz, middle row) and SO stacked lines (bottom row), with the white contours showing the 3σ levels and the pink contours which indicate the extent of the bright ring in the band 7 continuum emission (Isella et al. 2019). The white dots correspond to the position of the two protoplanets (Wang et al. 2021).
Current usage metrics show cumulative count of Article Views (full-text article views including HTML views, PDF and ePub downloads, according to the available data) and Abstracts Views on Vision4Press platform.
Data correspond to usage on the plateform after 2015. The current usage metrics is available 48-96 hours after online publication and is updated daily on week days.
Initial download of the metrics may take a while.