Fig. 7.
Download original image
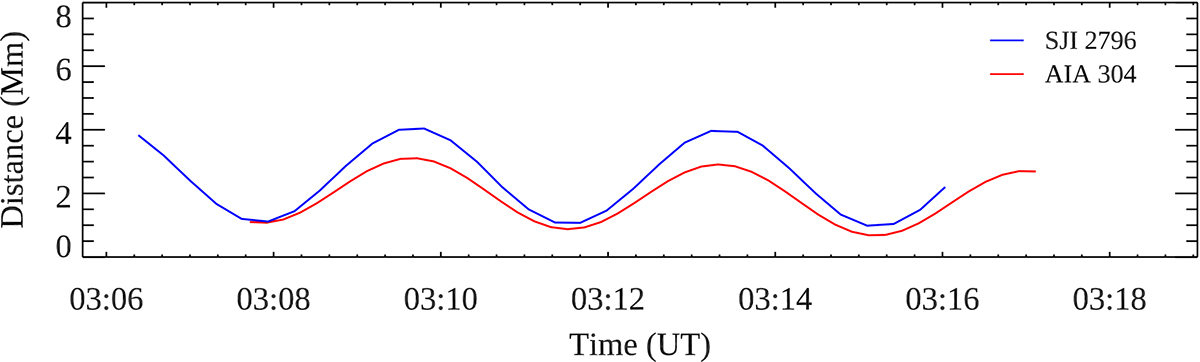
Phase lag of the oscillations detected in different passbands during coronal rain. Curves representing the oscillations observed in slit 3 during rain are shown for both SJI 2796 and AIA 304. The SJI 2796 oscillation amplitude is scaled by a factor of 7 to facilitate a more meaningful comparison. The phase difference between these oscillations is negligible.
Current usage metrics show cumulative count of Article Views (full-text article views including HTML views, PDF and ePub downloads, according to the available data) and Abstracts Views on Vision4Press platform.
Data correspond to usage on the plateform after 2015. The current usage metrics is available 48-96 hours after online publication and is updated daily on week days.
Initial download of the metrics may take a while.