Fig. 6.
Download original image
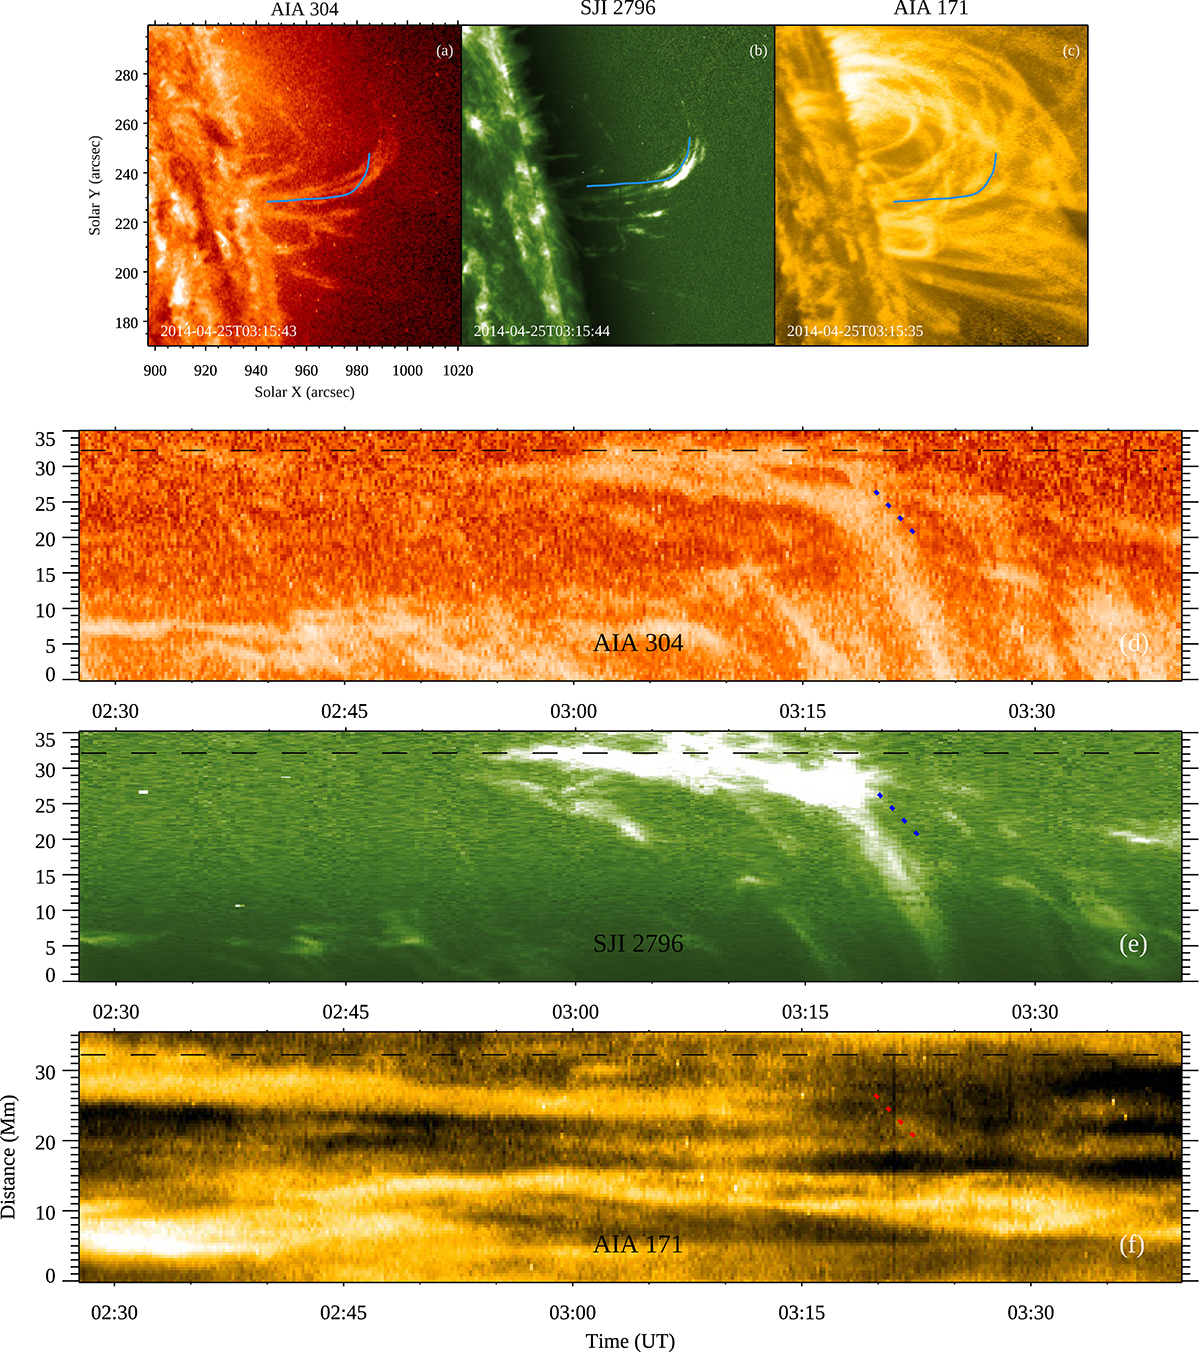
Oscillations captured in larger loop. (a) AIA 171 x − t map of Slit 3 for the time during and after coronal rain. The two vertical blue lines represent the time span from the first appearance of coronal rain until it reaches the footpoint of the loop in the SJI 2796 channel. (b) and (c) Oscillation captured in AIA 304 and SJI 2796, respectively, for the same slit when coronal rain appeared. The x − t maps for AIA channels are produced after motion magnification. All x–t maps are inverted in intensity.
Current usage metrics show cumulative count of Article Views (full-text article views including HTML views, PDF and ePub downloads, according to the available data) and Abstracts Views on Vision4Press platform.
Data correspond to usage on the plateform after 2015. The current usage metrics is available 48-96 hours after online publication and is updated daily on week days.
Initial download of the metrics may take a while.