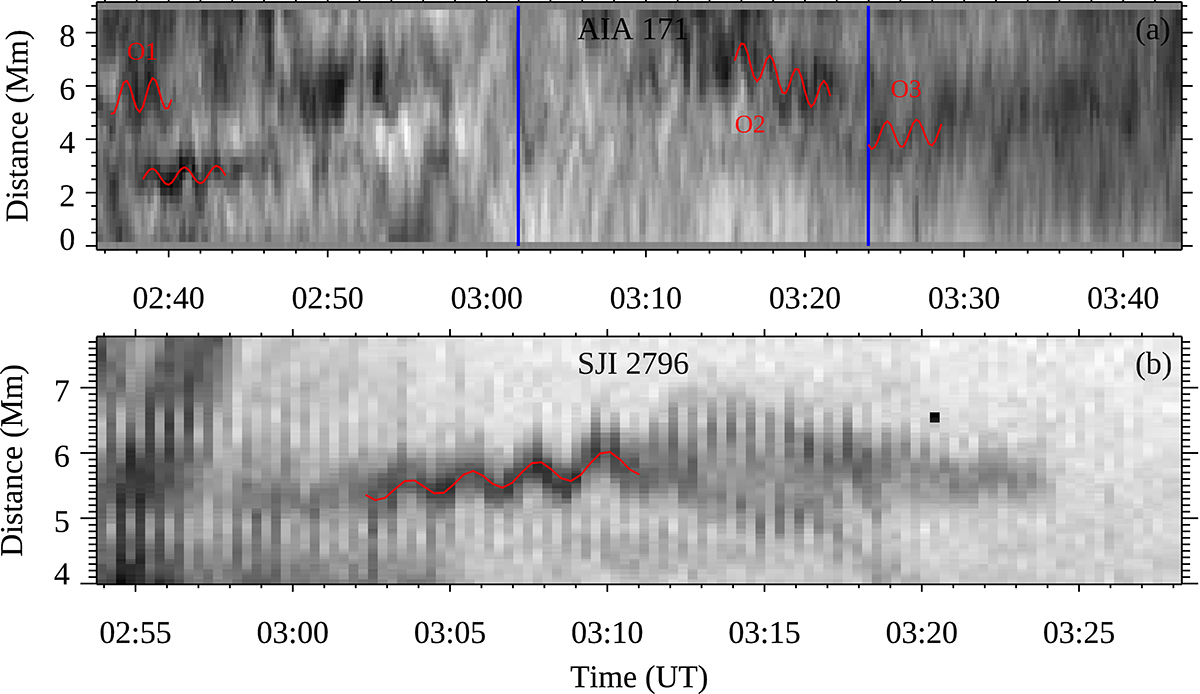
Fig. 4.
Download original image
Oscillations captured in smaller loop. (a) AIA 171 x − t map of Slit 8 for the time before, during, and after coronal rain. The blue vertical lines indicate the time interval when coronal rain was present in the SJI 2796 passband. The x − t maps for AIA channels are produced after motion magnification. These x − t maps are inverted in intensity. (b) The x − t map of Slit 8 in SJI 2796. The increase in amplitude is clearly visible, and the oscillation is fitted with the red curve.
Current usage metrics show cumulative count of Article Views (full-text article views including HTML views, PDF and ePub downloads, according to the available data) and Abstracts Views on Vision4Press platform.
Data correspond to usage on the plateform after 2015. The current usage metrics is available 48-96 hours after online publication and is updated daily on week days.
Initial download of the metrics may take a while.