Fig. 3.
Download original image
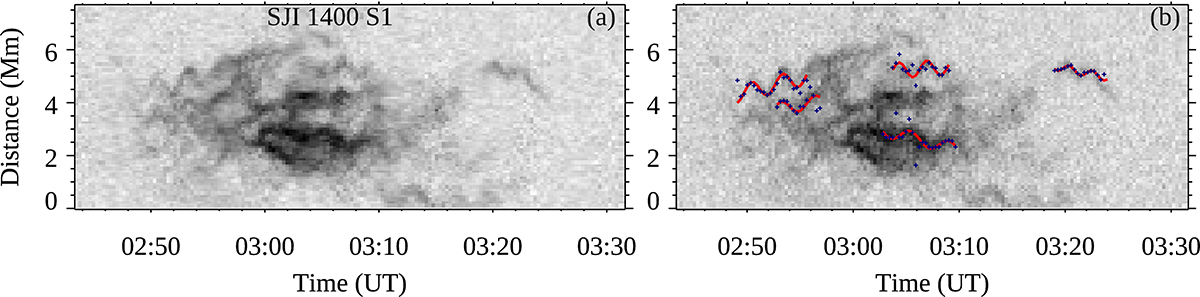
Oscillation detection and fitting. (a) Space-time map of Slit 1 near the apex of the loops in SJI 1400 are shown in Fig. 1. The negative intensity is shown in each map. These x − t maps show that the different rain clumps oscillate in phase at varying positions of the slits. The decay-less nature of transverse oscillations is also visible in the x − t maps. (b) The plus symbols mark the centers of the threads over-plotted with the obtained sinusoidal fits, which are represented by red curves. The oscillation properties are derived using sinusoidal fits.
Current usage metrics show cumulative count of Article Views (full-text article views including HTML views, PDF and ePub downloads, according to the available data) and Abstracts Views on Vision4Press platform.
Data correspond to usage on the plateform after 2015. The current usage metrics is available 48-96 hours after online publication and is updated daily on week days.
Initial download of the metrics may take a while.