Open Access
Fig. 2.
Download original image
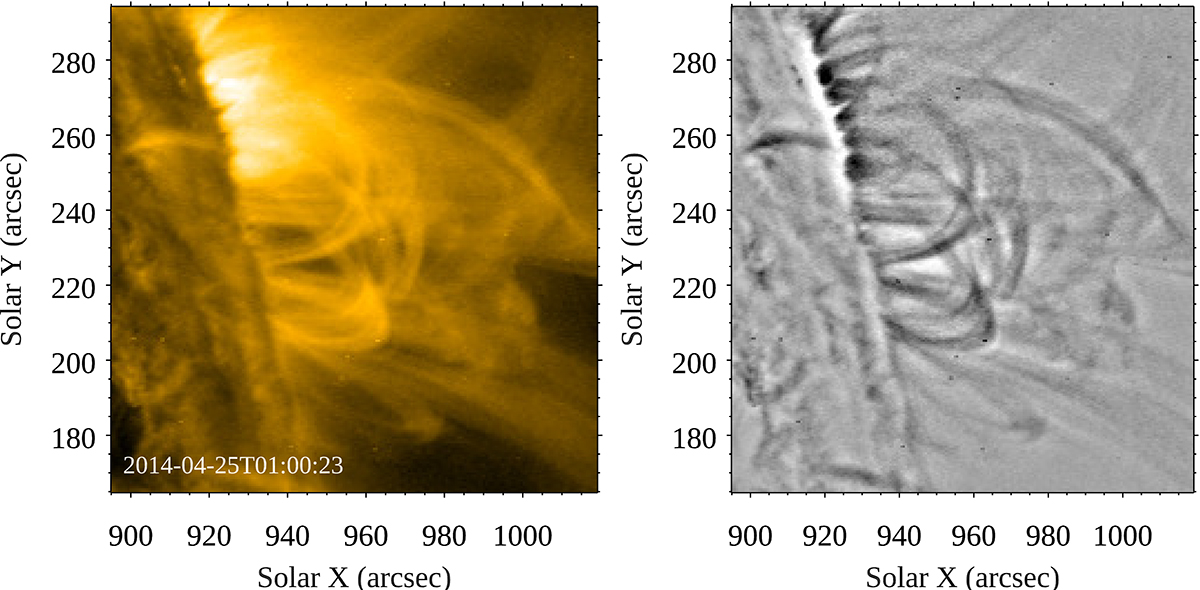
Example of edge detection in AIA 171 images. The left panel shows the AIA 171 intensity image of the small green box shown in Fig. 1. The fuzziness of the emission is clearly visible. The right panel shows the unsharp masked inverted image of the same FOV in which loop edges are enhanced.
Current usage metrics show cumulative count of Article Views (full-text article views including HTML views, PDF and ePub downloads, according to the available data) and Abstracts Views on Vision4Press platform.
Data correspond to usage on the plateform after 2015. The current usage metrics is available 48-96 hours after online publication and is updated daily on week days.
Initial download of the metrics may take a while.