Fig. 13.
Download original image
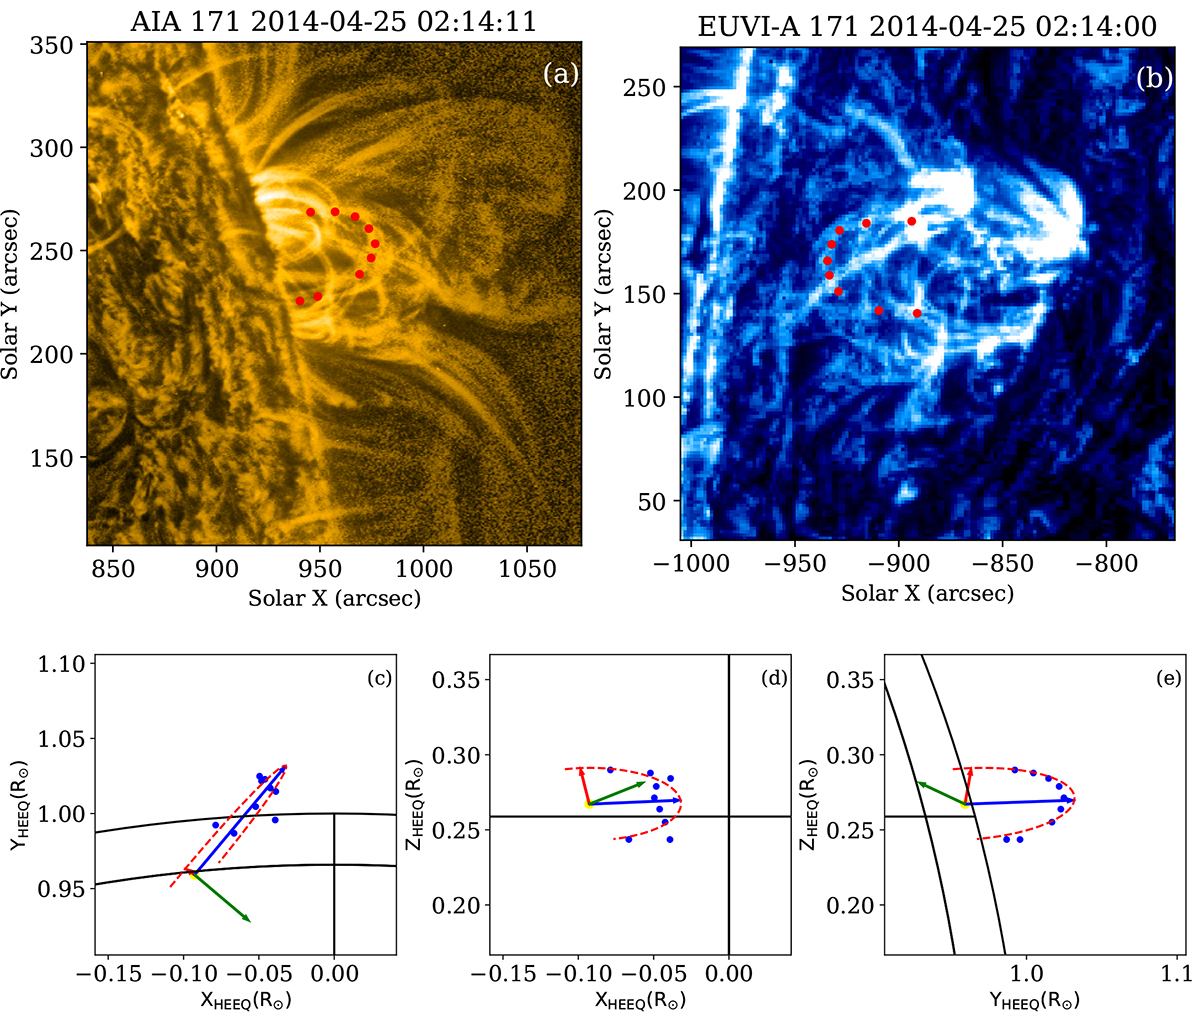
3D geometry of larger loop and estimation of inclination angle. Panels a and b show the regions of interest as viewed by AIA 171 and EUVI-A 171. The images were processed using the MGN filter. The red points lie on the epipolar line and are used for 3D reconstruction. Panels c–e present the projections of the reconstructed loop in three different planes in the HEEQ coordinate system. The red dashed line indicates the fitted loop. The red and blue arrows show the minor and major axis of the fitted loop, while the green arrow indicates the normal to the loop plane.
Current usage metrics show cumulative count of Article Views (full-text article views including HTML views, PDF and ePub downloads, according to the available data) and Abstracts Views on Vision4Press platform.
Data correspond to usage on the plateform after 2015. The current usage metrics is available 48-96 hours after online publication and is updated daily on week days.
Initial download of the metrics may take a while.