Fig. 10.
Download original image
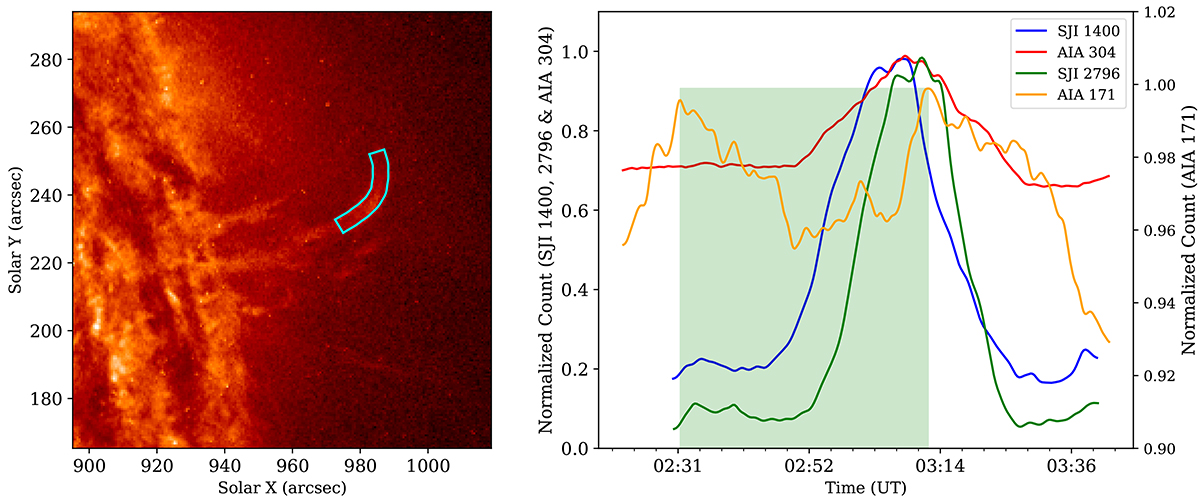
Intensity variation of the loop top in multiple passbands. The left panel shows the cyan box enclosing the loop top at which slit 3 was placed. The right panel shows the temporal evolution of the intensity summed over the cyan box in four passbands. The green box shows the time interval between the maximum of the counts observed in AIA 171.
Current usage metrics show cumulative count of Article Views (full-text article views including HTML views, PDF and ePub downloads, according to the available data) and Abstracts Views on Vision4Press platform.
Data correspond to usage on the plateform after 2015. The current usage metrics is available 48-96 hours after online publication and is updated daily on week days.
Initial download of the metrics may take a while.