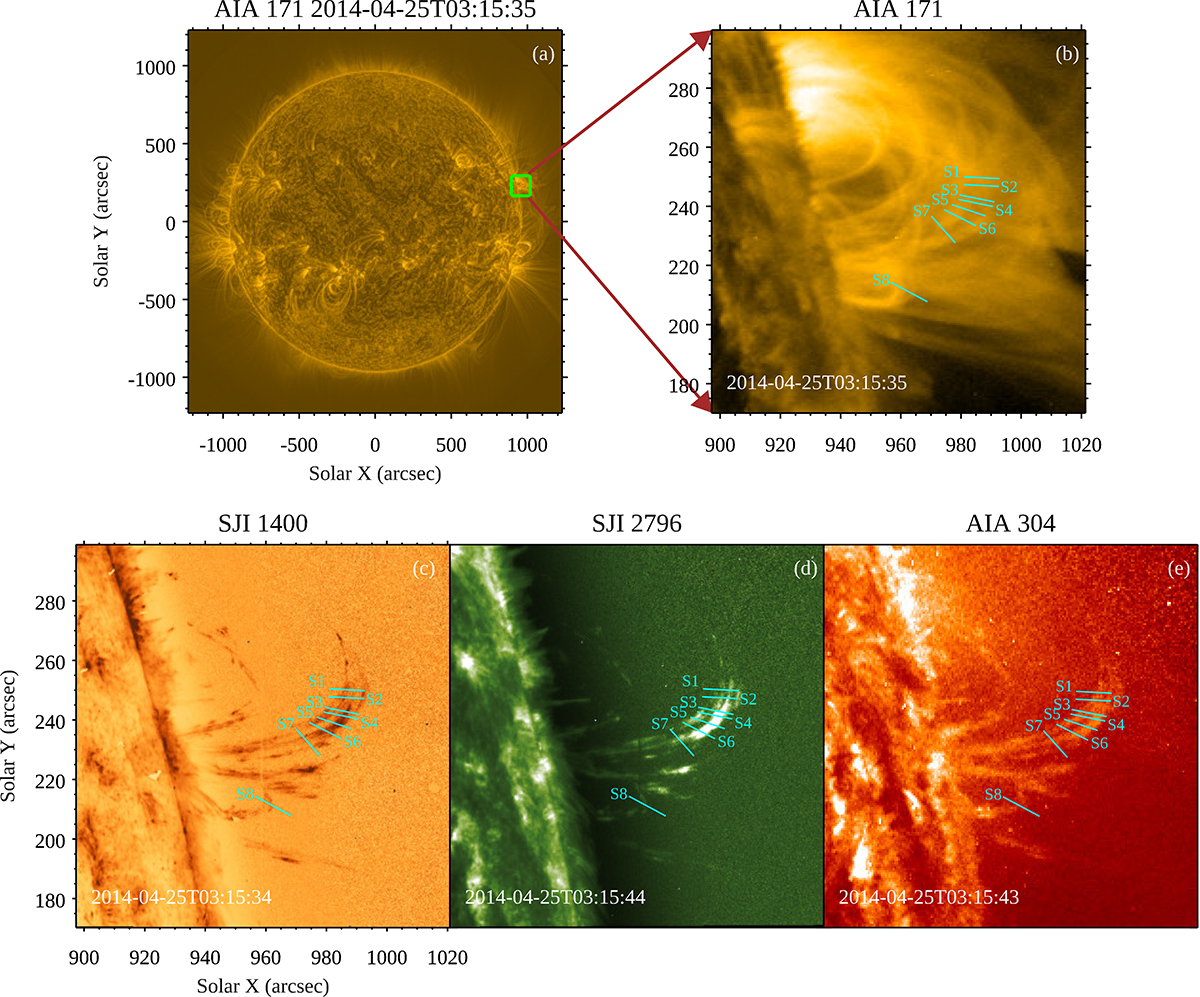
Fig. 1.
Download original image
Overview of the observation. (a) Full-disk intensity image of the Sun in AIA 171 processed using the MGN technique. The small green box highlights the event location and FOV of SJI. (b) Zoomed-in view of the green box in AIA 171 Å with the loop system. (c)–(e) Approximately simultaneous SJI 1400, 2796, and AIA 304 (radial-gradient-filtered) images. The presence of coronal rain in the loops can be seen. The cyan lines mark the position of artificial slits chosen for generating space-time maps. Slit 8 overlaps the position of a smaller loop. An animation associated with this figure is available online.
Current usage metrics show cumulative count of Article Views (full-text article views including HTML views, PDF and ePub downloads, according to the available data) and Abstracts Views on Vision4Press platform.
Data correspond to usage on the plateform after 2015. The current usage metrics is available 48-96 hours after online publication and is updated daily on week days.
Initial download of the metrics may take a while.