Open Access
Fig. 9.
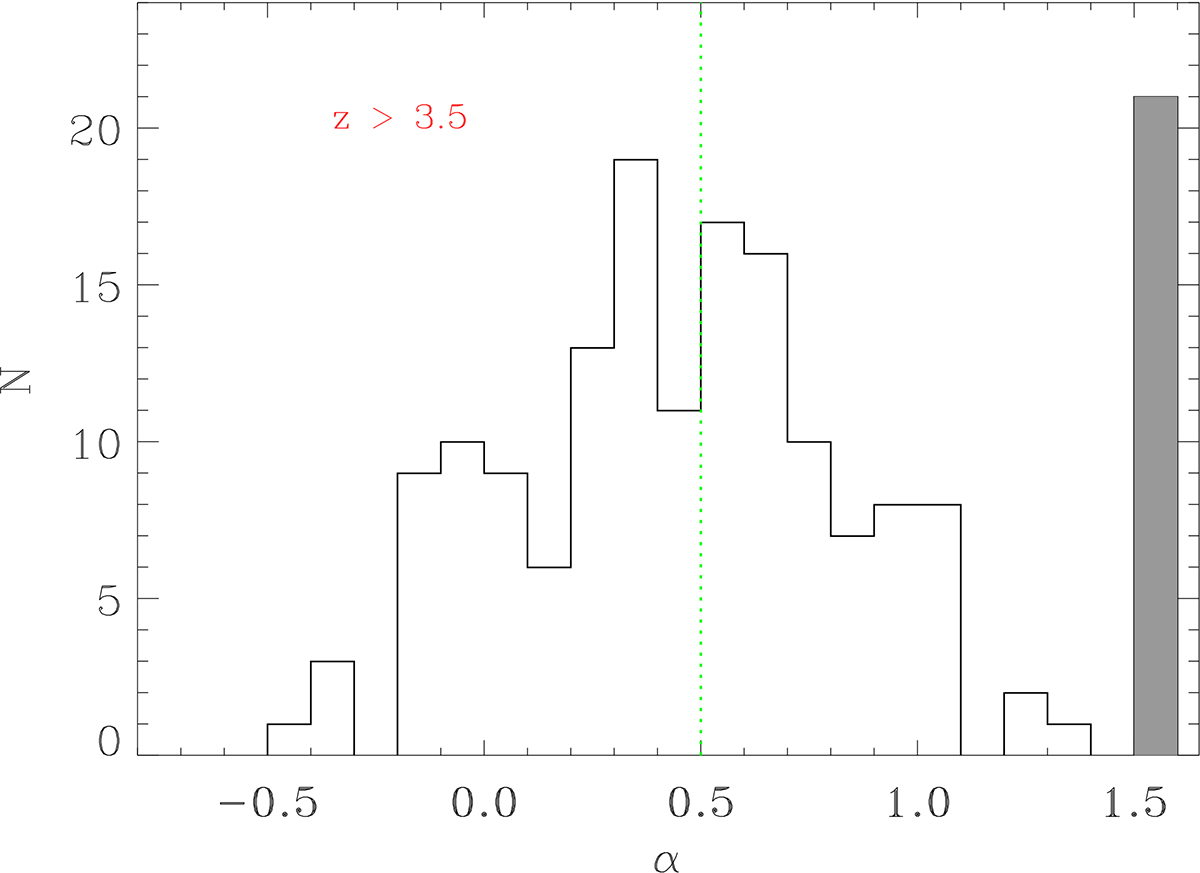
Download original image
Distribution of the spectral indices obtained with a linear fit to the LOFAR, FIRST, and VLASS data to the sources of the faint sample, that is, with P500 ≳ 1027 W Hz−1. The gray bar represents the 21 sources that were not detected by in the high-frequency surveys. The vertical dashed green line separates FSRQs from SSRQs.
Current usage metrics show cumulative count of Article Views (full-text article views including HTML views, PDF and ePub downloads, according to the available data) and Abstracts Views on Vision4Press platform.
Data correspond to usage on the plateform after 2015. The current usage metrics is available 48-96 hours after online publication and is updated daily on week days.
Initial download of the metrics may take a while.