Open Access
Fig. 5.
Download original image
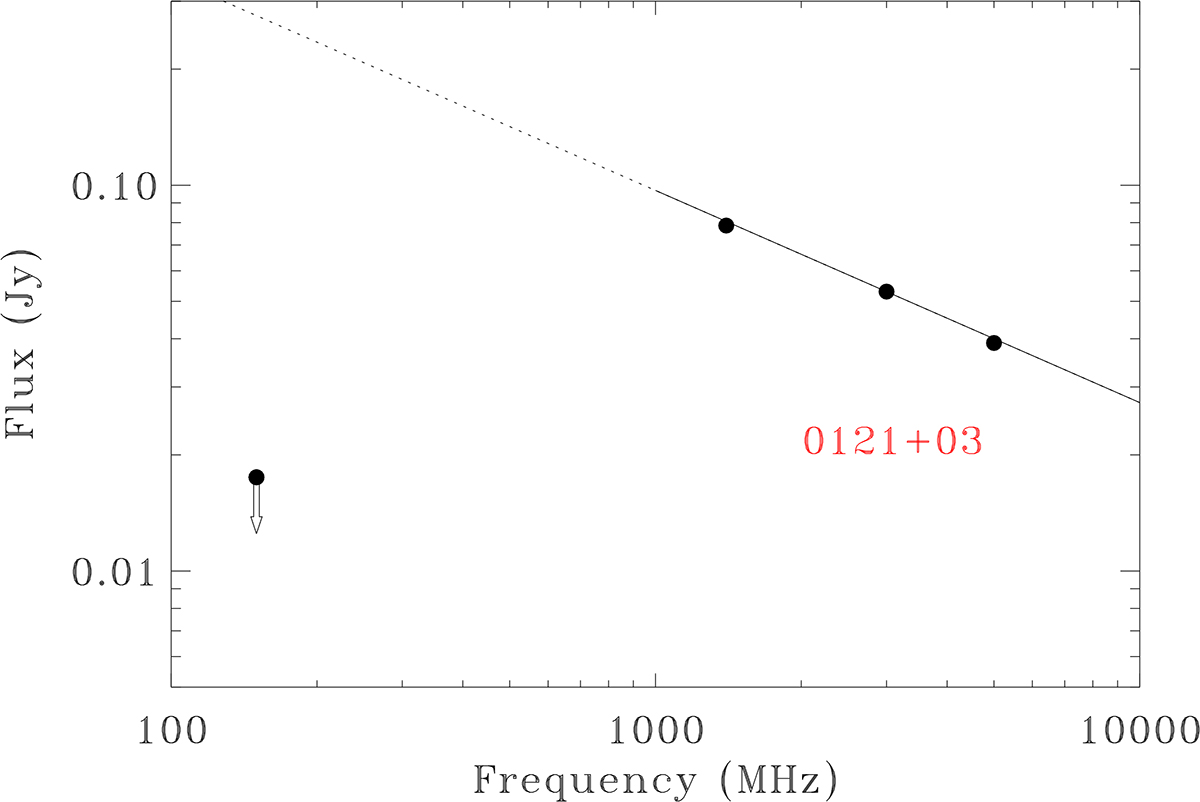
Example of a source with a turnover at low frequency, a likely CSS, missed by our selection at low frequency. The solid line is the best line fit to the high-frequency data. The extrapolation of the fit at low frequency (dotted line) is higher by a factor > 10 than the upper limit from the TGSS.
Current usage metrics show cumulative count of Article Views (full-text article views including HTML views, PDF and ePub downloads, according to the available data) and Abstracts Views on Vision4Press platform.
Data correspond to usage on the plateform after 2015. The current usage metrics is available 48-96 hours after online publication and is updated daily on week days.
Initial download of the metrics may take a while.