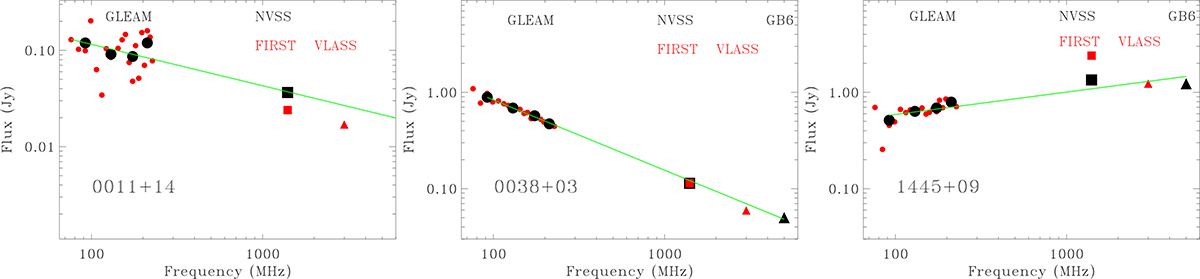
Fig. 3.
Download original image
Three examples of radio spectra. The low-frequency regime is covered by the GLEAM data (small red circles). Because the errors are relatively large, we also provide flux densities by rebinning five frequency channels (large black circles). The other flux densities are taken from the NVSS (black squares), FIRST (red squares), VLASS (red triangles), and GB6 (black triangles). Only data with a similar spatial resolution (i.e., from GLEAM, NVSS, and GB6, all marked with black symbols) are used to obtain the linear fit, which is represented by the green line.
Current usage metrics show cumulative count of Article Views (full-text article views including HTML views, PDF and ePub downloads, according to the available data) and Abstracts Views on Vision4Press platform.
Data correspond to usage on the plateform after 2015. The current usage metrics is available 48-96 hours after online publication and is updated daily on week days.
Initial download of the metrics may take a while.