Fig. 7.
Download original image
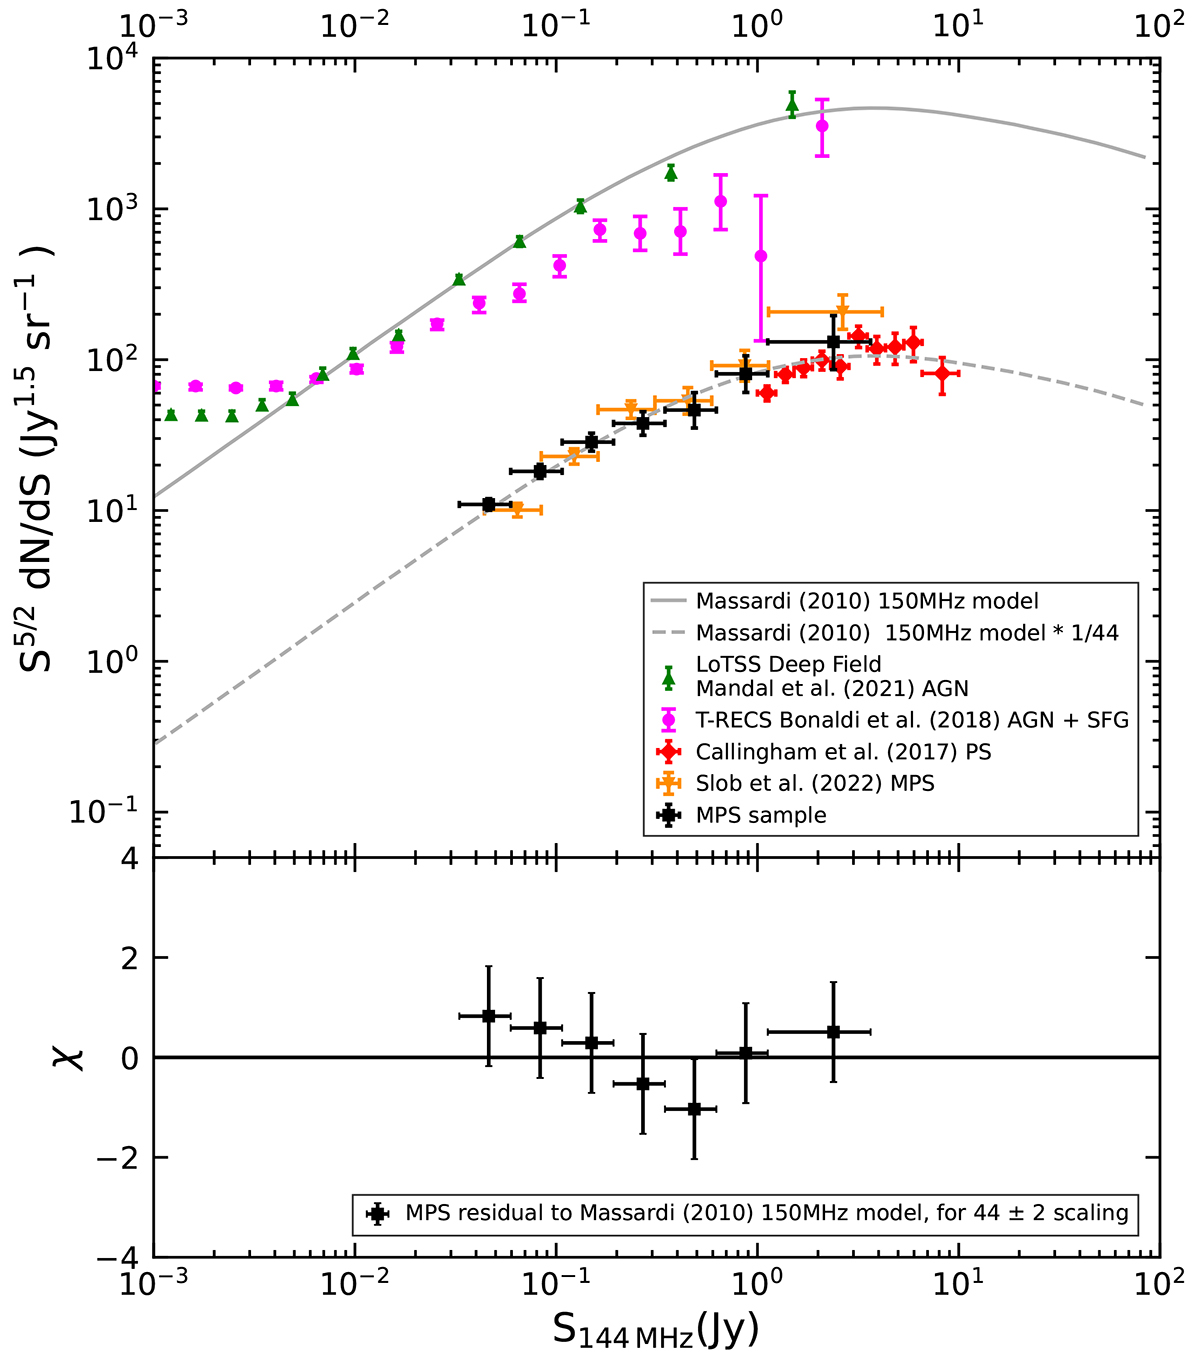
144 MHz Euclidean normalized differential source counts. Top: The source counts of our MPS sample. Plotted are also the source counts from Callingham et al. (2017) and Slob et al. (2022), which are samples of PS sources. To compare them to a general population of AGN, the 150 MHz source counts from the LoTSS Deep Field (Mandal et al. 2021) are plotted. The 150 MHz source counts from the T-RECS simulation (Bonaldi et al. 2019) are plotted as well. The 150 MHz model of large-scale AGN from Massardi et al. (2010) is indicated by the solid gray line. This same model scaled down by a factor of 44 is indicated by the dashed gray line. Bottom: The residuals of our MPS source counts to the Massardi et al. (2010) 150 MHz model rescaled by a factor 44.
Current usage metrics show cumulative count of Article Views (full-text article views including HTML views, PDF and ePub downloads, according to the available data) and Abstracts Views on Vision4Press platform.
Data correspond to usage on the plateform after 2015. The current usage metrics is available 48-96 hours after online publication and is updated daily on week days.
Initial download of the metrics may take a while.