Fig. 5.
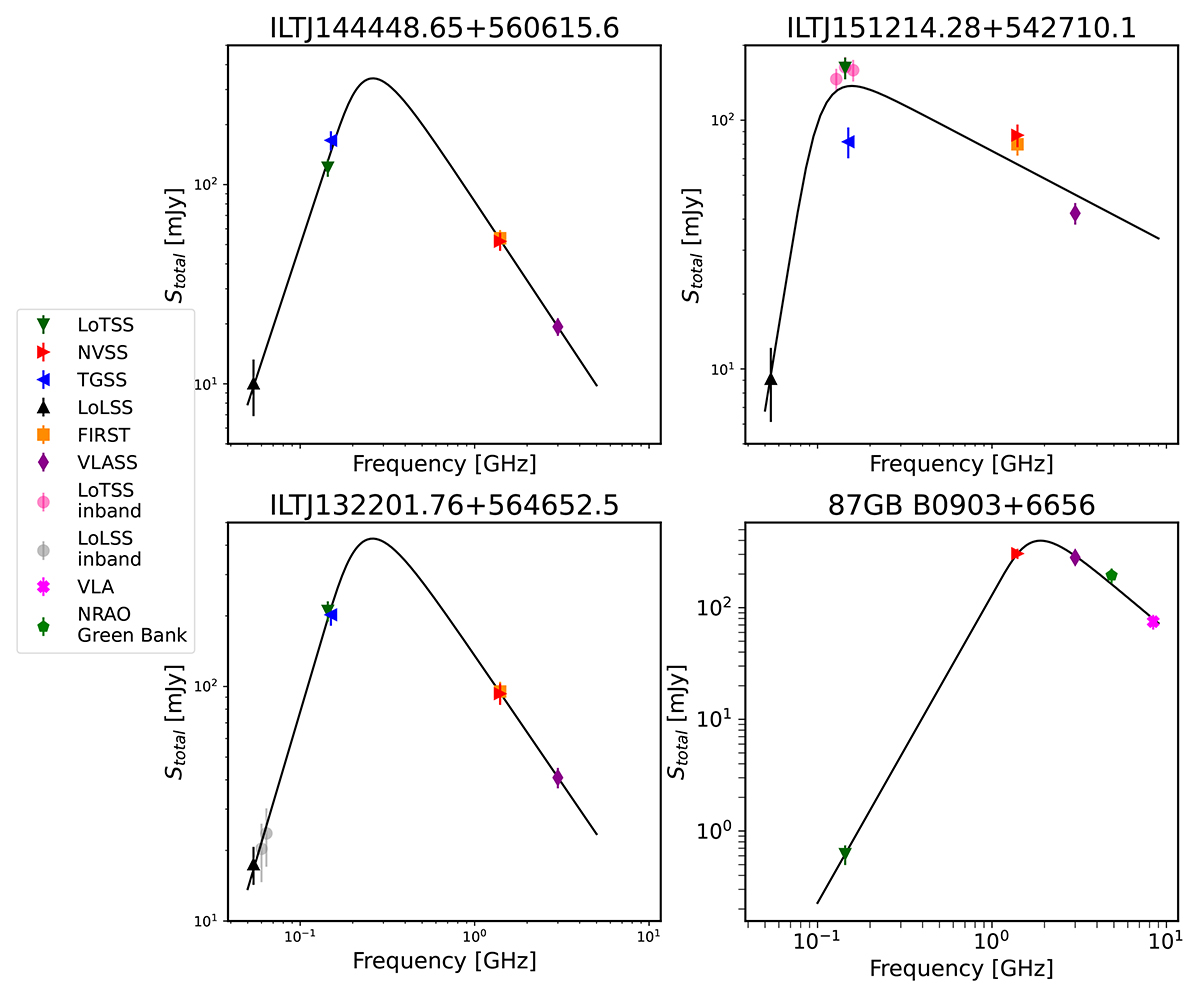
Download original image
SEDs of the four sources in our sample with extremely steep spectral indices. The curve from Eq. (3) was fitted to the radio flux density measurements available for these sources and is indicated as a black curve. Upper left: ILTJ144448.65+560615.6, which has a spectral index between LoLSS and LoTSS of αlow = 2.5 ± 0.4. Upper right: ILTJ151214.28+542710.1 with a spectral index between LoLSS and LoTSS of αlow = 2.9 ± 0.5. Lower left: ILTJ132201.76+564652.5 with a spectral index between LoLSS and LoTSS of αlow = 2.5 ± 0.3. Lower Right: 87GB B0903+6656 (ILTJ090723.44+664446.6), with a spectral index between LoTSS and NVSS of αlow = 2.7 ± 0.1. For this source, we additionally plot a 4.58 GHz observation taken by the NRAO Green Bank telescope (Becker et al. 1991), and an 8.4 GHz observation taken by the VLA (Healey et al. 2007).
Current usage metrics show cumulative count of Article Views (full-text article views including HTML views, PDF and ePub downloads, according to the available data) and Abstracts Views on Vision4Press platform.
Data correspond to usage on the plateform after 2015. The current usage metrics is available 48-96 hours after online publication and is updated daily on week days.
Initial download of the metrics may take a while.