Fig. 3.
Download original image
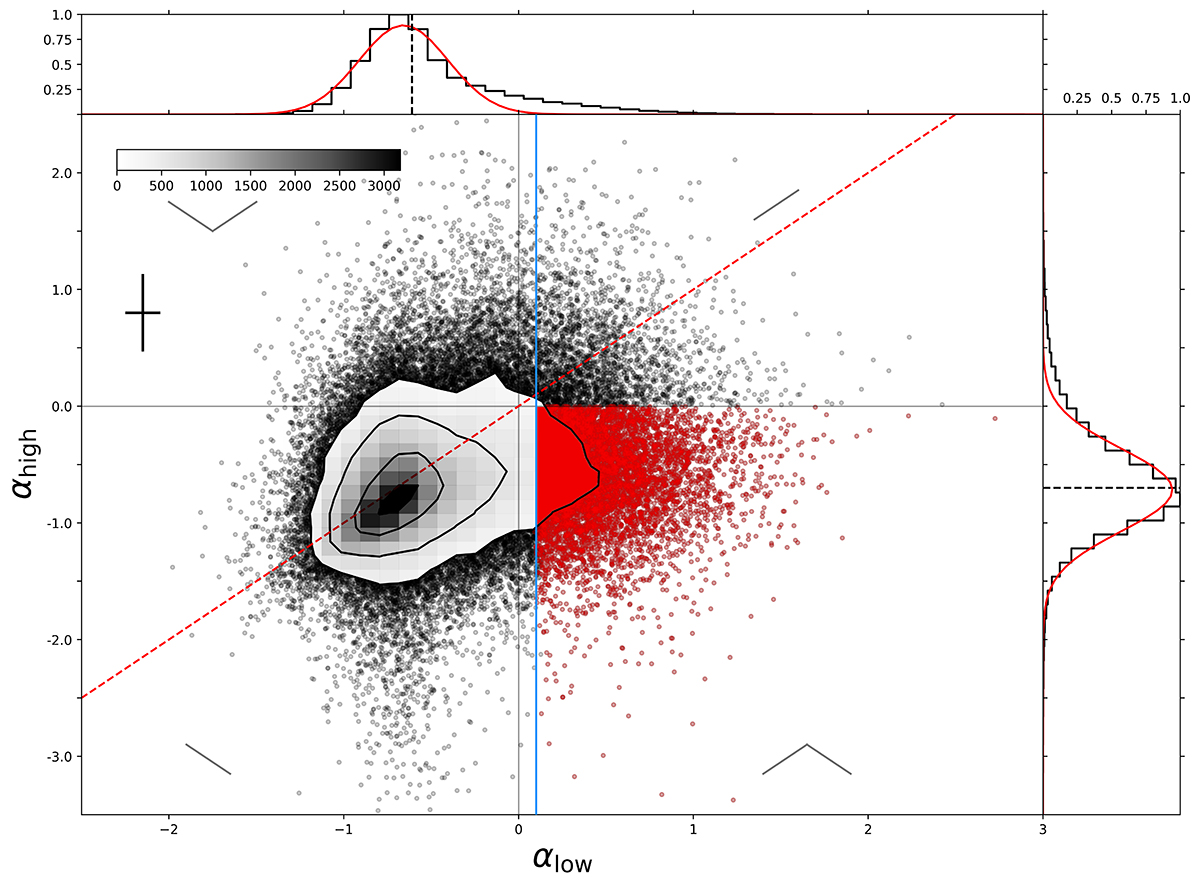
Color-color plot for the 108 473 sources in our GPS sample, where αlow is the spectral index between LoTSS (144 MHz) and NVSS (1400 MHz), and αhigh is the spectral index between NVSS and VLASS (3 GHz). PS sources exist in the lower right quadrant and are indicated in red. The blue line represents the median of the error of αlow at 0.10, which corresponds to the median of the selection limit of PS sources. The contours represent 134, 416, 1349, and 2800 sources. The red dashed line represents the 1:1 ratio of the spectral indices. The median error bars are plotted instead of the individual errors, for readability. The normalized distributions of αlow and αhigh are plotted, with a median and standard deviation of −0.6 ± 0.4 respectively −0.7 ± 0.5. Mock SEDs are shown, to indicate the rough shape the SED of a source in each quadrant would have.
Current usage metrics show cumulative count of Article Views (full-text article views including HTML views, PDF and ePub downloads, according to the available data) and Abstracts Views on Vision4Press platform.
Data correspond to usage on the plateform after 2015. The current usage metrics is available 48-96 hours after online publication and is updated daily on week days.
Initial download of the metrics may take a while.