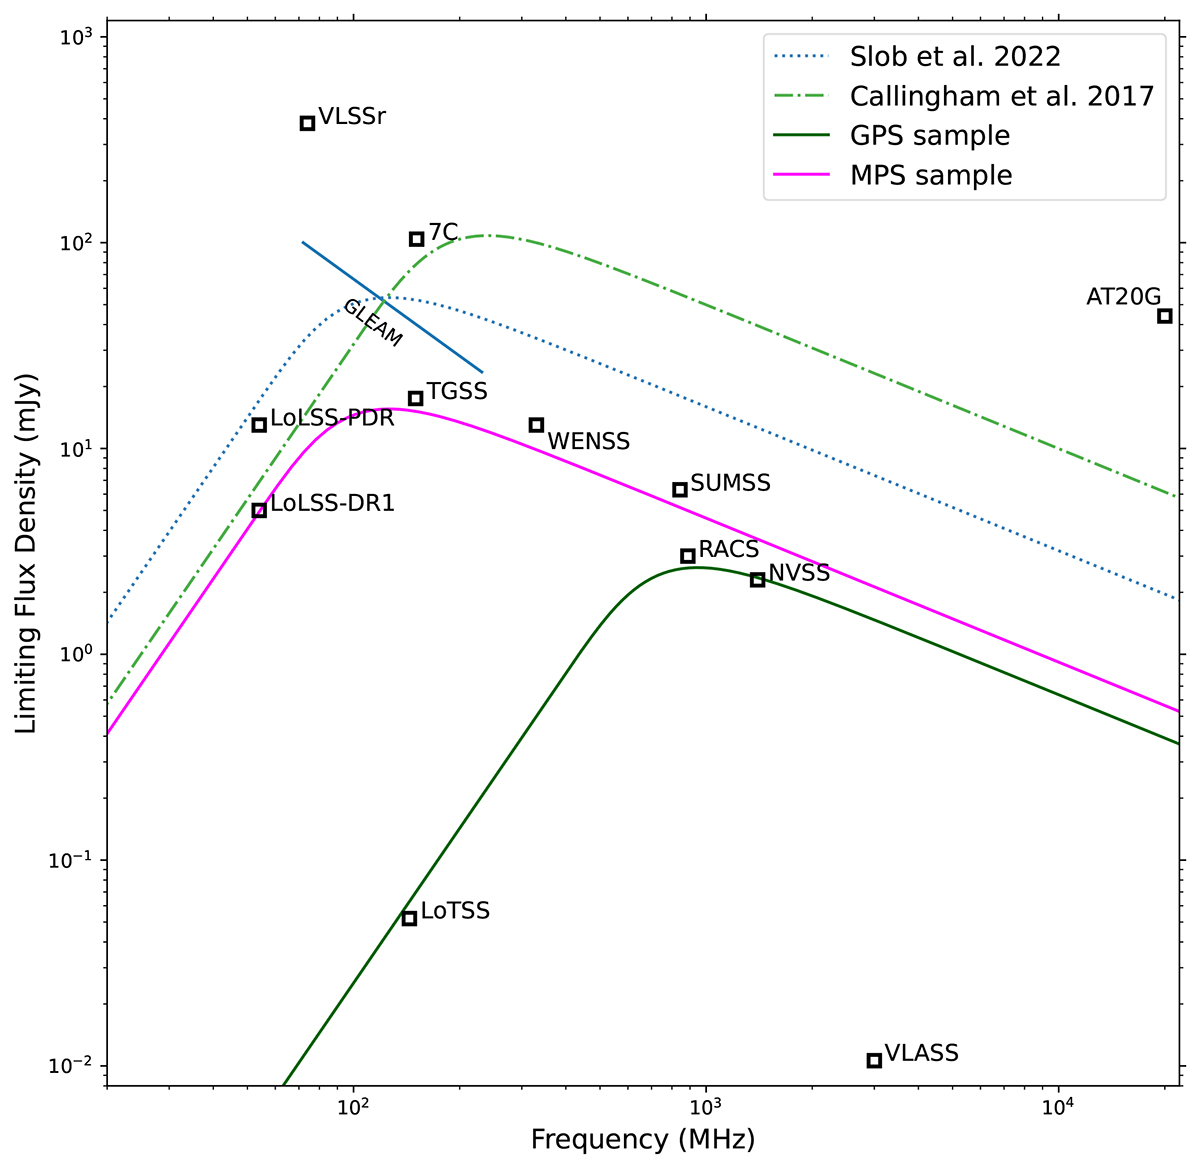
Fig. 1.

Download original image
Observational limits of different radio surveys, as well as literary PS samples which are indicated at their central frequency. The lowest cataloged component flux density reported for each survey used in this research, and other relevant large radio surveys, is indicated in the plot. The GaLactic and Extragalactic All-Sky MWA Survey (GLEAM; Wayth et al. 2015) is represented by a line since it has variable limiting flux densities at different observing frequencies. The Callingham et al. (2017) sample is represented by an SSA model with a faintest peak flux density of 160 mJy at a turnover frequency of 190 MHz. The Slob et al. (2022) sample is represented by an SSA model with a faintest peak flux density 80 mJy at a turnover frequency of 100 MHz. We indicate the sensitivity of our samples with SSA models with a limiting flux density of 23 mJy at a turnover frequency of 100 MHz for the MPS sample, and with a limiting flux density of 3.9 mJy at 750 MHz for the GPS sample. In the figure, multiple wide-field radio surveys were indicated that have not been mentioned before; the Westerbork Northern Sky Survey (WENSS; Rengelink et al. 1997), Sydney University Molonglo Sky Survey (SUMSS; Mauch et al. 2003), Cambridge 7C (Hales et al. 2007), Australia Telescope 20 GHz (AT20G; Murphy et al. 2010), Very Large Array Low-Frequency Sky Survey Redux (VLSSr; Lane et al. 2014), TIFR GMRT Sky Survey Alternative Data Release 1 (TGSS; Intema et al. 2017), and the RAPID ASKAP Continuum Survey (RACS; Hale et al. 2021).
Current usage metrics show cumulative count of Article Views (full-text article views including HTML views, PDF and ePub downloads, according to the available data) and Abstracts Views on Vision4Press platform.
Data correspond to usage on the plateform after 2015. The current usage metrics is available 48-96 hours after online publication and is updated daily on week days.
Initial download of the metrics may take a while.


